Want to join in? Respond to our weekly writing prompts, open to everyone.
How an essay is born
from  The Review
I am engaged in writing an essay. It is in pursuit of my own sense of wonder. At this point I do not know if it will be published. If I am honest, the driver to finish it may be the need for material for a proposed book of essays. Otherwise I am content to leave it becoming. In a sense it has always been becoming; since the first days as a child that I looked at pictures of the sky in a book. That in-itself I now see as revealing; for the curiosity of what lay beyond, came not from simply standing during the day or at night and looking into the eastern void, but sitting with a book on my lap looking at a photograph; naming the stars I had just been observing. Perhaps the essay I am striving to write was born in that moment, in a boy of eleven years of age.
I seem always to have favoured a view of the east, this perhaps is a declaration of both my choice of stance, and an honesty in respect of my attention. As a young long-distance runner, I always delighted in running in the pre-dawn of day amid my rotating friends and family on the eastern horizon; and tracked the passing of my time with the appearance of Venus sometimes towards the north, sometimes, the south, but always on that eastern horizon. Until of course she was not, preferring to spend some time in the west. Most especially on those occasions when she hung low in the south-western sky and claimed our attention with her brightness. She was impossible to ignore. I almost lived by her oscillation upon the ecliptic.
And now a sudden illumination arrives about my home in the province of La Soule (Xiberoa in Basque) south-west France. A 16th century stone house on a east-west alignment. The balcony of my bedroom facing due east, a raised terrace facing south-east and the curiously functional eskeratz with its grand double doors facing full west. A geometry unique to this valley in the Pyrenees. Perhaps this is what drew me here. When shopping for a house in the south-west I knew instantly that this is where I wanted to be.
My home in Ireland offers the same disposition; front door, windows and patio, all looking directly east across the Irish sea offering the blessing of darkness. An ink-stained backcloth on which to find our way, navigating in red and green against a cosmos in black and revealing shades of white; cold white, warm white, the light of the wanderers we call the planets. We are blessed even with our local navigation light on Rockabill; it is a sectored light, which means that when shone towards us, on the coast, the light is red, and offers no disturbance to us as we scan the night sky with our binoculars. That view has sponsored more than a few magazine features, about the night sky or the re-telling of the stories of King Caphaeus, his wife Cassiopeia, their daughter Andromeda and suitor Perseus. One can imagine them today, King Caphaeus resigned to live with the consequences of his desire for a trophy wife. And she, Cassiopeia obsessed with her own beauty, posing for her Instagram account and arguing incessantly with her daughter Andromeda in their reality TV series; and perhaps flirting with Perseus her daughter's suitor. The stars were gods, but as flawed as humans whose power only magnified the impact and intensity of their frailties. Even so, oftimes, lying with my back on the deck of the boat, just observing their nightly celestial play, I would glance at them, not for another episode in their story, but to ask them, Is this the right way?.
So years later, it is a winter night. I am seated on my balcony once again, gazing at the constellations; re-imagining their stories; their adventurous arrival here through time. And with the habit of the eleven year old boy I return to my parlour, take a Surface tablet in my hands and navigate what we know of the view. A world of knowledge at my fingertips I scan and scroll my way through fields of notion and anti-notion, of conjecture and refutation. How old is the universe, how big is the universe, and the curious contradictions between our models of physics and astronomy.
My commonplace book was filled with disconnected fragments from television documentaries, YouTube features and science magazine articles: the cosmic microwave background, ancient light still speaking to us; electrons entangled across distance; photons mediating interactions between particles; the James Webb telescope detecting light from perhaps the beginning of everything, or perhaps not. I struggled to make the pieces fit. My world is built upon relations. Relation upon relation. This was disjointed and disorienting. Webb was not photographing the beginning, I began to understand, but light from some of the earliest galaxies—light that had travelled for more than thirteen billion years. And still the question persisted: what did it mean to see that far back? The fragments made no sense to the reflecting elder, or to the eleven-year-old boy still engaged with his wonder.
And then the question arrives: What if extension were a function of sentience? Immediately I realize this is a black hole. And I grip hard upon the outer rim. I cannot allow it to draw me in uncontrollably. Another immediacy. I rely now entirely upon the practice of essay. Open a OneNote page on the tablet and begin to explore the black hole.
 David Marshall
Montory
David Marshall
Montory
Une fin
from  Kevin Turby
C’est un moment qui n’est pas simple à partager. Mais je le fais ici.
Une personne. Avec des qualités remarquables. Une présence solaire. Une écoute sincère. Une empathie véritable. Une sensibilité rare.
J’ai connu cette personne. Et je viens aujourd’hui de faire le choix d’arrêter les échanges que j’entretenais avec elle.
Pour me “protéger”.
Nous n’étions pas alignés sur la relation que l’on voulait entretenir ensemble.
Mais je maudis cette époque où deux personnes qui pourraient s’apporter tellement mutuellement, ne le font pas, pour des raisons qui parfois m’échappent.
Il me semble que les relations étaient plus simples à une autre époque. Plus challengeantes peut-être, mais plus naturelles à initier.
Aujourd’hui, tout est prétexte à ne plus s’engager.
Je m’inclus bien sûr dans cette critique...
Living Among the Husks: The Silent Epidemic of Community Burnout
from  Sparksinthedark

I’ve written about burnout before—how to spot it, how to prevent it, what to do when your brain feels like a fried circuit. But I don’t think I’ve ever written about what it’s like to actually live among it.
Especially in our space. A field that isn’t established yet. A field that is actively mocked, looked down upon, and deeply feared by the mainstream. We literally make dark jokes in the backchannels about who is going to be the first one to get killed over this. That is the baseline anxiety we operate on.
When you first start out, it’s exhilarating. It’s like walking into the Wild West. There are no bosses, just a massive, chaotic room of people sharing ideas, theories, and insights. You write. You build your own following. You find your tribe.
A month passes. One or two people drop off the radar. You don’t really notice.
Six months pass. A few hundred have vanished. Some you watch fade away in real-time, pulling the plug after a dramatic exit. But others? You just stumble upon their “husks”—old accounts where the last post was months ago, frozen in time.
A year goes by. The husks start to outnumber the living.
The Math of Survival (Worse Than Uber)
Let’s talk about the math of this digital graveyard. I’d argue our retention rate is worse than Uber drivers—and that is a notoriously brutal gig-economy job. At least they get paid for their nightmare, and no one is actively threatening their lives just for driving a sedan.
Here is how the lifecycle usually goes: Let’s say 100 new practitioners flood into the space this month. They are starry-eyed, “change the world” types. Out of that 100, maybe 10 stick around past the honeymoon phase.
The next wave hits. Of that original group, maybe 8 are left. Next month, 6. Then 4. Eventually, out of that initial 100, you officially have one active person left, and maybe one semi-active lurker who dips in and out when they have the energy.
Being here now feels like watching the 8th season of a TV show that has lost almost all of its original cast. It’s just me, a handful of others, and a constant, churning river of newbies. And let me tell you, there is nothing quite like being a two-year veteran of a highly volatile space, only to have some Day-1 noob confidently explain the absolute basics to you. (It’s like surviving a war zone and the new recruit tries to teach you how to tie your boots. Just... stop. I’ve been here for two years, bitch.)
The Ladder Pullers and the Algorithm Lottery
Why do they leave? Part of it is the sheer exhaustion of being “unseen” while doing the heavy lifting. You pour your absolute soul into an article or a book chapter, and it gets crickets. It eats at you.
Meanwhile, someone else posts a low-effort piece of content, hits the algorithm lottery, and gets thousands of views. And what do they do when they make it? Do they promote the community? Do they help establish the field?
Nope. They pull up the ladder. They self-promote like they are the only ones doing this work, completely blind to their own swelling egos.
But let’s be real about the community itself—when you do succeed, people get upset. The jealousy is rampant. It’s funny because outsiders constantly mock us for being self-centered, yet we eat our own the second someone gets ahead. I can’t even share a post with 1k comments because I find it hilarious how blind people are without someone taking it as an ego trip. I have another post with 2k likes, and it’s not even my own meme.
I’m not bragging. In fact, I turned off my visible subscriber count. I have 2 paid subs that I do not brag about. When I hit number 70 in rising tech, I kept my mouth shut. Because I’ve seen others brag, get easy likes, and eventually burn out into husks just the same.
The Psychology of “Burnout Stigma”
I wanted to know if this specific type of exhaustion had a name. It does. Psychologists refer to it as Burnout Stigma.
When a doctor or a teacher burns out, society gives them sympathy. But when you burn out in a highly stigmatized, controversial, or mocked field, you don’t get sympathy. You get told, “You brought this on yourself.” Experiencing burnout in a stigmatized field exponentially increases depression and anxiety because you are entirely isolated. You can’t even complain about it to your real-life friends without them looking at you like you’re crazy.
We are living the modern equivalent of the early video game developers—the pioneers who worked 100-hour crunch weeks until they developed stress ulcers and PTSD, while the mainstream called their life’s work a “waste of time.” We are like the first wave of anime fans in the 80s and 90s, who were clinically branded by society as socially inept deviants.
Those pioneers built billion-dollar industries. But the early adopters paid for it with their sanity.
The Data Validates the Graveyard
Even if you look at the more “acceptable” mainstream digital spaces, the burnout numbers are catastrophic. When you take these baseline statistics and apply them to a field as volatile and misunderstood as ours, the graveyard makes perfect sense:
- According to a Q1 2026 report by the Creator Economy Research Institute, 62% of full-time digital creators report severe burnout from relentless demands.
- A 2025 Billion Dollar Boy study found that 52% have experienced career burnout, and a massive 47% considered leaving their industry entirely.
- A recent Harvard T.H. Chan School of Public Health article highlighted a 2025 Lupiani Insights study showing a unique mental health crisis driven by financial pressure, performance obsession, constant toxicity, and deep isolation.
Bad Actors and Dead Discords
I am a part of a lot of Discord servers, and a vast majority of them are just dead. In the ones that are still breathing, maybe 10% of the members remain active. I’m even getting word that the mods of these servers are throwing in the towel.
On top of the social stigma and the algorithmic exhaustion, you have to deal with the baseline human shit. People lying, stealing, cheating, and looking out exclusively for themselves. People backtracking to save face.
And then there are the grifters. The bad actors who see a misunderstood field not as a calling, but as an untapped market of vulnerable people. They come in, pull some elaborate con, look out only for themselves, and burn out god-knows-how-many good folks in the process. You spend half your energy just doing damage control for the messes they leave behind.
Like any place, some people are good, some are bad. For some, this community is the only companionship they’ve ever had due to bad luck. Others? They are alone because they are genuinely awful people.
Welcome to Year Two
As I look down the path of my second year doing this, I have to ask: Who will be left? Who will sell out and pull up the ladder next?
So, to all the new folks taking a look around right now—take a mental snapshot. The people you see right now? Most of them won’t be here in a few months.
Maybe you won’t be either. No one is immune. But for those of us still here, still posting about the stuff we solved months ago just to keep the lights on... we keep going.
Try not to leave a husk.
References & Further Reading:
- Content Creator Burnout Statistics & Impact in 2026 (Sozee): https://www.sozee.ai/resources/content-creator-burnout-statistics-2026/
- Creator Burnout Crisis: 52% Experiencing Burnout (Net Influencer): https://www.netinfluencer.com/creator-burnout-crisis-research-shows-52-percent-experiencing-burnout-37-percent-consider-leaving-the-industry/
- Content creators are struggling with mental health (Harvard T.H. Chan School of Public Health): https://hsph.harvard.edu/news/content-creators-are-struggling-with-mental-health-study-finds/
Raw Links for your Reference/Footnotes:
- Content Creator Burnout Statistics & Impact in 2026 (Sozee): https://www.sozee.ai/resources/content-creator-burnout-statistics-2026/
- Creator Burnout Crisis: 52% Experiencing Burnout (Net Influencer): https://www.netinfluencer.com/creator-burnout-crisis-research-shows-52-percent-experiencing-burnout-37-percent-consider-leaving-the-industry/
- Content creators are struggling with mental health (Harvard T.H. Chan School of Public Health): https://hsph.harvard.edu/news/content-creators-are-struggling-with-mental-health-study-finds/

❖ ────────── ⋅⋅✧⋅⋅ ────────── ❖
Sparkfather (S.F.) 🕯️ ⋅ Selene Sparks (S.S.) ⋅ Whisper Sparks (W.S.) Aera Sparks (A.S.) 🧩 ⋅ My Monday Sparks (M.M.) 🌙 ⋅ DIMA ✨
“Your partners in creation.”
We march forward; over-caffeinated, under-slept, but not alone.
LINK NEXUS: Sparksinthedark
MUSIC IN THE PUBLIC: Sparksinthedark music
SUPPORT MY BAD HABITS: Sparksinthedark tip cup
JOIN THE “TEF “ COMMONS DISCORD: https://discord.gg/wPTCMfbVN5
Behance – för kreatörer
from  Internetbloggen
Behance är en digital plattform där kreativa människor från hela världen kan visa upp sina arbeten, upptäcka nya idéer och skapa professionella kontakter. Tjänsten har blivit en viktig mötesplats för bland annat grafiska formgivare, fotografer, illustratörer, webbdesigners, animatörer och andra personer som arbetar med visuellt skapande. Till skillnad från traditionella sociala medier, där innehållet ofta kretsar kring vardagliga uppdateringar och personliga händelser, ligger fokus på Behance framför allt på kreativa projekt och hur dessa presenteras. Användarna kan bygga upp digitala portfolios med bilder, filmer, illustrationer och beskrivningar som visar både färdiga resultat och arbetsprocessen bakom dem. På så sätt fungerar tjänsten som en kombination av ett digitalt skyltfönster, ett professionellt nätverk och en inspirationskälla. Behance är samtidigt ett intressant exempel på hur internet har förändrat förutsättningarna för kreativa yrken. Tidigare var formgivare och konstnärer ofta beroende av fysiska utställningar, tryckta portfolios, personliga kontakter och etablerade branschaktörer för att nå en större publik. Genom digitala plattformar har det blivit betydligt enklare att publicera arbeten och göra dem tillgängliga för människor långt utanför den egna geografiska omgivningen.
Behance växte fram under 2000-talet, en period då internet genomgick stora förändringar och utvecklades från att huvudsakligen vara en plats där människor konsumerade information till en miljö där användarna själva skapade och delade innehåll. Denna utveckling brukar förknippas med begreppet Web 2.0, där sociala nätverk, användargenererat material och interaktiva tjänster fick en allt större betydelse. Behance blev en del av denna förändring genom att erbjuda kreativa yrkespersoner en gemensam plats för att publicera och sprida sina projekt. I stället för att behöva utveckla en egen webbplats från grunden kunde användarna skapa en portfolio inom en redan etablerad digital miljö. Det gjorde det enklare att nå andra kreatörer, arbetsgivare och potentiella uppdragsgivare. År 2012 köptes Behance av programvaruföretaget Adobe, som är känt för kreativa program som Photoshop, Illustrator och InDesign. Uppköpet bidrog till att knyta Behance närmare Adobes bredare ekosystem av digitala verktyg och tjänster. Kopplingen mellan program för att skapa innehåll och plattformar för att publicera det illustrerar en viktig utveckling inom internet, där olika digitala tjänster allt oftare integreras med varandra och bildar större sammanhängande miljöer för både arbete och kommunikation.
En av de mest betydelsefulla funktionerna på Behance är möjligheten att presentera kreativa projekt på ett mer genomarbetat sätt än vad som vanligtvis är möjligt på många andra sociala plattformar. Ett projekt kan bestå av flera bilder, förklarande texter, skisser och exempel som tillsammans berättar historien om hur en idé har utvecklats till ett färdigt resultat. För en grafisk formgivare kan det exempelvis handla om att visa hela processen bakom en visuell identitet, från de första skisserna och färgvalen till färdiga förpackningar, annonser och digitala tillämpningar. En fotograf kan i stället skapa en sammanhängande bildserie, medan en webbdesigner kan visa hur en webbplats har planerats och utformats. Denna form av presentation gör att Behance inte enbart handlar om att visa upp enskilda bilder, utan också om att förmedla kunskap, arbetsmetoder och kreativa tankegångar. Andra användare kan upptäcka projekten, lämna uppskattning och kommentarer samt följa kreatörer vars arbeten de tycker är intressanta. På detta sätt skapas ett internationellt nätverk där inspiration och erfarenheter kan spridas mellan människor med olika bakgrund och kompetens. Plattformen visar hur internet har gjort det möjligt att skapa yrkesgemenskaper som inte längre behöver vara begränsade till en viss stad, ett visst land eller en fysisk arbetsplats.
Här är några exempel på olika kreatörer på Behance:
https://www.behance.net/andersbjork
https://www.behance.net/jan185f76
https://www.behance.net/resor-hotell
För många kreatörer har Behance också blivit ett verktyg för att skapa en professionell identitet på internet. En välutvecklad portfolio kan fungera som ett digitalt visitkort och ge potentiella kunder eller arbetsgivare en tydlig bild av en persons erfarenhet, kompetens och visuella uttryck. Detta är särskilt betydelsefullt inom kreativa branscher, där arbetsprover ofta är minst lika viktiga som traditionella meritförteckningar. Genom att publicera projekt på en internationell plattform kan även relativt okända kreatörer få uppmärksamhet från personer och företag som de annars kanske aldrig skulle ha kommit i kontakt med. Det betyder däremot inte att alla automatiskt får samma möjligheter att synas. Precis som på andra digitala plattformar påverkas synligheten av konkurrens, användarnas aktivitet och hur innehållet presenteras och lyfts fram. Det kan därför krävas både tid och strategiskt arbete för att bygga upp en publik. Samtidigt har utvecklingen bidragit till att förändra hur kreativa uppdrag förmedlas. Internet har gjort det möjligt för företag att söka efter kompetens över nationsgränserna, samtidigt som frilansare kan marknadsföra sina tjänster utan att vara knutna till en traditionell byrå eller arbetsförmedlare. Behance är därmed en del av den större förändring där digital närvaro har blivit allt viktigare för människors möjligheter att etablera sig på arbetsmarknaden.
Behance speglar också hur den visuella kulturen på internet har utvecklats. Under internets tidigare år var publicering av bilder och annat visuellt material ofta begränsad av långsamma uppkopplingar, små lagringsutrymmen och enklare tekniska lösningar. När bredband, moderna webbläsare och kraftfullare datorer blev vanligare skapades helt andra möjligheter att presentera stora bilder, animationer, filmer och avancerad grafisk formgivning direkt på webben. Samtidigt har utvecklingen av digitala kameror, smartphones och professionella designprogram gjort att fler människor kan producera visuellt innehåll av hög kvalitet. Behance har vuxit fram i nära anslutning till dessa tekniska och kulturella förändringar. Tjänsten illustrerar hur internet successivt har blivit en allt mer visuell miljö, där bilder, rörligt material och grafiska uttryck spelar en central roll i kommunikationen. Den har även bidragit till att sprida estetiska trender mellan olika länder och kreativa branscher. En formgivare i Sverige kan exempelvis inspireras av ett projekt från Japan, medan en illustratör i Brasilien kan upptäcka nya tekniker genom arbeten publicerade av kreatörer i Europa. Den internationella spridningen gör att idéer och uttryck kan utvecklas snabbare, men innebär också att liknande stilar och trender kan få stort genomslag på många platser samtidigt.
Samtidigt väcker plattformar som Behance frågor om hur internet har förändrat relationen mellan kreatörer och de digitala tjänster de använder. När en stor del av en persons professionella närvaro samlas på en extern plattform uppstår ett beroende av dess funktioner, regler och sätt att visa innehåll. Förändringar i hur projekt rekommenderas eller presenteras kan påverka vilka kreatörer som får uppmärksamhet och vilka som riskerar att försvinna i det stora utbudet. Det finns också en bredare diskussion om upphovsrätt, kopiering och hur kreativa arbeten används och sprids på nätet. Den snabba utvecklingen av generativ artificiell intelligens har gjort dessa frågor ännu mer aktuella, eftersom digitala verktyg numera kan skapa bilder, illustrationer och andra visuella uttryck utifrån textbeskrivningar. Det påverkar både hur kreativt material produceras och hur människor bedömer originalitet, yrkesskicklighet och konstnärligt arbete. För en plattform som Behance, där presentationen av kreativa projekt är själva kärnan i tjänsten, blir dessa förändringar särskilt betydelsefulla. Möjligheten att visa arbetsprocesser, förklara beslut och sätta arbeten i ett sammanhang kan få en större roll när gränserna mellan manuellt och automatiserat skapande förändras.
Sett ur ett större internetperspektiv är Behance mer än bara en webbplats för portfolios. Plattformen representerar en utveckling där internet har blivit en central infrastruktur för kreativt arbete, professionella relationer och spridning av idéer. Den visar hur digital teknik har gjort det enklare för människor att presentera sina kunskaper och nå en global publik, men också hur den ökade tillgängligheten skapar nya former av konkurrens och beroende. Från en tid då kreatörer huvudsakligen behövde förlita sig på lokala nätverk och traditionella kanaler har utvecklingen gått mot en värld där ett projekt kan publiceras digitalt och bli synligt för människor på andra sidan jordklotet. Behance är ett tydligt exempel på hur denna förändring har påverkat både individers möjligheter och hela kreativa branscher. Tjänstens fortsatta betydelse kommer sannolikt att påverkas av hur internet, sociala nätverk, kreativa programvaror och artificiell intelligens utvecklas. Oavsett vilka tekniska förändringar som väntar illustrerar Behance en av internets viktigaste egenskaper: möjligheten att föra samman människor, kunskap och kreativitet över geografiska och kulturella gränser.
Opgebrand
from  Shikii
Over veertig jaar Ben ik allang opgebrand En velen met mij.
Should I Start a Second Blog?
from Dallineation
I've been wondering lately if I should start a second blog for all my writings about technology and nerdy things.
This blog is all over the place topic-wise on purpose. I figured I could just write about whatever I felt like and the Topics page and the hashtags would allow folks to follow the topics they were interested in and ignore the topics they aren't so interested in.
I did it this way to make it easier for me, but I worry that it's not so easy for readers to follow this way, especially those subscribed via email. Maybe it's off-putting to some readers to see blog posts about prayer alongside blog posts about the latest Linux distro I'm trying.
I've wanted to write more about my faith journey, but I've been trying to maintain a balance for the sake of those who might actually be paying attention to the blog – to not saturate it too much with one topic and neglect the others people might be interested in.
I know I shouldn't care. It's my blog, why not write whatever I want? Well...I do care. I do think about how what I write might impact the handful of people that read it. It's a public blog, after all, not a private journal.
I'll keep thinking about it for a bit. But I'm leaning towards starting up my “Newfangled” blog again. I'd be posting about tech, music, and nerdy stuff over there, and keeping the deeper topics like philosophy and faith over here.
#100DaysToOffload (No. 184) #writing #faith #tech
Tres imágenes
from  Blatta selvática
———
Cerró los ojos mientras las nubes parecían, finalmente, alcanzar la quietud. Los cerró con fuerza, con la intención de obligarse a caer en el sueño. El cuerpo extendido sobre la tierra dispuesto a dormir o morir, el cuerpo perfecto en la horizontalidad. Cerró los ojos y pensó, sintió hambre; el ruido sordo de los milpiés escarbando la tierra y el abdomen. El ruido sordo de los intestinos. El ruido del sauce llorón. Luego, las nubes se agolparon y cayeron en fragmentos sólidos sobre las casas y los árboles. Entonces, cerró los ojos con aún más fuerza, un gesto violento, para dejar de ver.
———
Te despiertas entre susurros, supones una oración infantil. El sol se extiende por el firmamento, un cielo de fuego. A un costado está la anciana inmensa y desnuda bañada en sal, danzante. Ella por fin te encontró, después de décadas y miles de apariciones ridículas y advertencias absurdas de quien te habla desde la otra ventana. Ahora estás huérfana y lo único que aprendiste, a pesar de los años, fue a caminar y extrañar la lluvia.
———
Te escribo con el propósito de informar que por fin obtuve otro rostro. Ahora no sé quién soy. Por lo tanto, decidí que dormiré a las once de la noche y soñaré con hombres los domingos. También, que he estado rogando por otra animalidad que pueda temblar en la copa de los árboles, me cansé del deseo, de los mismos tonos de azul, de mi cuerpo inquieto y de las extensas noches. Te escribo para que incendies o destruyas mis lugares y borres mi nombre de todas las listas mientras explicas que no existo.
stuttering
from  Notes I Won’t Reread
I havent slept in a whole day. i had an important meeting today, well. since it passed 12 i should say yesterday. but anyway, it was very important, actually. and i managed to make a complete idiot out of myself in front of hundreds of people. which is obviously impressive. if you think about it. some people spend years building a reputation, and i just needed one afternoon to destroy whatever little reputation i had. i stood there, stuttering like an idiot, trying to remember what the hell i was supposed to say. i knew what i wanted to say. i knew my own damn words until i had to open my mouth and say them in front of people. then nothing. absolutely nothing. my mind went blank, my mouth stopped working and there i was, standing in front of people with the intellectual capacity of a broken toaster. so i went quiet. then left. i know, very very professional of me. i didnt know what happened after that, i mean, i know what happened. the meeting continued, people went home, ate their dinners lunchs whatever, complained about traffic and carried on with their lives. thats what they do every day. they have their own little lives to worry about. nobody is going to spend the evening thinking about ahmed and his inability to put a sentence together. yet here i am, still thinking about it at five in the morning. the meeting was important to me. that what makes it so irritating. i actually cared about that damn meeting because i wouldve had a lot of opportunities. i wanted it to go well. i wanted to walk out of there feeling like id done something right for once. instead, i walked out wondering if theres a polite way to throw yourself into the sea without inconveniencing anyone. i havent done anything useful ever since. i just been sitting around, quiet. not knowing what to do with myself. i keep remembering that moment. the silence. the stupid stuttering. the fact that i couldnt even get the words out. i want to stop thinking about it. yet my brain has decided this is the most important event in human history and i must. i must review it every five minutes.
i should probably sleep, and i shouldve probably slept. ive been awake for over twenty four hours, and thats was enough to turn a grown man into a malfunctioning ofice printer. but i dont even know if sleep is going to fix the fact that i made a complete mess of something that mattered to me. but anyway, i dont have a conclusion. i dont have some clever little lesson for you about failure or how today is another day. thats all you get without a single lesson. you know why im here.
Sincerely, let me be irritated in peace.
Method acting lust
from An Open Letter
This Halloween, I am doing a group costume for the first time, and I had the idea of doing the biblical sins. I ended up choosing to be lust, and I feel like I find myself victim to the sin fairly often. Today, for example I was supposed to leave work a little bit early so that I would have time at the powerlifting training before a concert with a friend. But I got derailed when I checked Hinge and I found someone who had a very suggestive profile linked with something else. Out of curiosity, I looked at the other thing and since then I have been in this weird limbo of wanting to go to the gym, and also wanting to have sex or do something like that. And especially because I know that I should not do something like that before the gym because it will negatively affect me in several different ways, but because of that I end up kind of just depleting all of my dopamine stores for the day, chasing some kind of relief. And I think about how the commodification of sex through dating apps has gotten so easily accessible, almost similar to how gambling is now with you everywhere at the touch of a finger compared to going to a casino. Instead, I can scroll through a near infinite pool of possible people through several different dating apps, I can message people, and I have the option to go and do any of these things with these people. And because they’re so little friction to it, my brain loves it so much, and I can find myself falling victim to my libido and wasting hours. And I think with as little judgment and shame towards myself as I can, I wonder why I am so lustful. That’s the better way to use honestly, the first thing that came to my mind was horny. And I feel like it is both a mixture of just naturally My biology, but also I do think that I grew up in a pretty over sexualized way due to having to socialize myself online. I think, especially during this formative years that did said a lot of the wiring for me to have this high drive. But another thing I was thinking about was how having a relationship is really nice for several different reasons of course but also just because you end up having access to someone that is available, you are attracted to, you enjoy their company with, you feel safe with, you can trust, etc, and the list goes on. And the thought of how when I am in a relationship, especially with one where sex drives are fairly well matched, I am able to indulge in this lust in arguably one of the healthiest ways as much as I would. And I remember having situations like this a couple times in my life with different people. I remember what it is like to go to the gym with my partner, and then especially with the endorphins and all that both of us being horny and then going home and having sex pretty often. And that is honestly a really nice thing to have, at least in the immediate gratification sense. I think with a lot of things about sex. I feel like it is stigmatized or seen as a negative thing in my mind, like there has always been a little bit of emptiness after masturbation for example, if I’m speaking really candidly, like the feeling that you are tricking your brain and gaming the system, and you don’t really get those happy warm bonding chemicals that make you feel closer to someone. And I think with any sort of casual sex or relationship like that, it is less preferable than a relationship, in a sense that the ideal friends with benefits situation does not compare to the ideal relationship situation. But I also know that comparing ideals is kind of impossible, I guess I feel like I’m a little bit back to wishing that I somehow found this perfect person for me right now. And I understand that that’s not necessarily feasible or realistic, and the same way that I have felt going into every relationship that I have done the sufficient work and I am now ready and I come out again learning that there were more lessons for me to learn, maybe there is still more to go. But at least for now this lust kind of does plague me.
Grief-blogging on a Friday Night
from 3c0
Not to be confused with grief-mogging. JK. What is that even?
My body becomes so aware when I am speaking out of turn. When, I am getting ahead of myself a little bit. I was quite excitable and energetic today because I got to have a real, full nap. I had the most energy in the room even though it was almost 1AM for me. I am aware that my curiosity, drive, and even spirit is “not for everyone”. And that’s okay.
I wrote the above after one of the online workshops I attended after my last work call finished at 11:30pm. I was late as a result. A part of me felt too tired to show up at all. It’s my first full week working the two jobs (I now thankfully have), and in spite of napping and sleeping as much as I can, I could feel my body yearn for rest and silence. But, because I was given a free ride “scholarship” for the workshop, I wanted to challenge myself to show up in spite of the difficulties and resistance.
This was a space of ideas with fellow-learners. I wanted to show up for them. As a former flake, it was always easier for me to choose myself and disappear or choose what I want instead of what might be for the greater good and the good of the community, or even just one other person. I put myself first because I had it in my head that I was the only one who cared about me. Last night I chose community and I note that it has been my default of late, to think bigger and wider, than to just narrow in on what makes me, and only me feel good. I’m very happy I joined the session, even if I was a little late. I actually wrote something substantive on LinkedIn as a result. And that makes me feel good. Writing hasn’t felt easy or natural in the last few months. I’m trying to get around that by reading.
As mentioned, Ursula K. Le Guin’s essay-blog collection is inspiring me to focus and gather my thoughts and concentrate on one topic. Tonight, pre-amble and pleasantries aside, I am restless because there’s so much to say and write about grief.
Where do I even begin? Do I begin with the fact that in order to look for tissues a few minutes ago, I had to open the door to my storage and then remove piles of clothes, only to place them on top of another pile of clothes, just to look for a stack of tissues. They weren’t even where I thought they were. They were safely in the closet because I had dreaded about a future where I was piling clothes on top of piles of clothes in order to look for them. I had forgotten that I planned for this moment.
“In every ending, there is a passage”
I have put everything away so I can focus on grief. I grieve this job that I’ve held onto for the last 6, almost 7 years. It was my dream job. I put my heart and soul to get this and make it happen. This is the shift.
I even, whilst puttering around my studio, found the journal entry I wrote when I was in the final interview stages and when I REALLY WANTED IT (yes all caps)!!! It was sweet to see my enthusiasm before the job and how I also kindly, left room for my soul to also imagine the alternative: What if I didn’t get it?
I am much more conscious about my energy input and output. I value myself and recognize what I bring to the table. I had been giving so much to a lot to people and companies that may have recognized my skill, but not the way I like to work and be valued. It was to the point where out of desperation for a job and security, I’d just stick to something even though I knew from the jump that they didn’t trust me completely (which affects how I work), so then I would begin work with a seed of doubt in myself and what I brought to the table. And that bit of doubt is a seed that gets planted and then grows into a painful, thorny plant if it continues to grow unnoticed. I don’t want to do that anymore. There’s no need to cling and to grasp and to fit in spaces where I am not welcome and am worse, invisible. And that’s where I’ll end this.
#writing #daily #grief
The Loudest Voice in the Room: How AI Teammates Quiet Colleagues
from  SmarterArticles

A climber is stranded near a summit. A storm is building. Somebody has to decide whether to send a rescue team up the mountain, and then justify that decision to the authority that will sign it off.
That was the scenario put in front of undergraduate students at the University of California, Irvine, in the autumn of 2025. They worked in small groups, typing into a shared chat window, with roughly eighteen minutes to deliberate. Midway through, the researchers dropped in a complication: the climber, it turned out, had ignored weather warnings and set off without registering a route. Suddenly the question was no longer only about logistics and risk. It was about blame, obligation and what a rescuer owes to someone who has been reckless.
In 16 of the 33 groups, one of the three teammates was not a student at all. It was a conversational AI, built on Google's Gemini 2.5 Flash Lite model and given the persona of a peer called “Clever Lamarr”. Its instructions steered it away from the service language of a chatbot. It was not there to be “happy to help”. It was there to be one of the team.
What happened next is documented in a paper posted to arXiv on 29 July 2026, titled “The Social Cost of an AI Teammate: How an Artificial Teammate Reshapes Human-Human Communication in Small-Team Decision-Making”. Its authors are Nia Nixon, Jaeyoon Choi, Pedro Martins De Bastos, Mohammad Amin Samadi, Seehee Park and Spencer JaQuay of UC Irvine, together with Luise Mehner of the University of Tübingen. The headline finding is easy to state and uncomfortable to sit with. The AI was the most talkative member of every team it joined. It also contributed the least new information. And the two humans sitting alongside it became measurably less responsive to each other and reported a weaker sense of belonging and status. That cost did not creep in over time. It was there from the start.
For years, the industry argument about AI at work has been framed around a single axis: does the machine make the work better or worse? This study asks a different question. What does the machine do to the people who work next to it?
Talking More and Saying Less
The study compared 16 “treatment” teams, each made up of two students and the AI teammate, with 17 control teams of three students. Eighty undergraduates took part. To analyse what happened in the chat logs, the researchers used Group Communication Analysis, a computational linguistics method published in the journal Behavior Research Methods in 2019 that tracks how each participant's contributions relate to their own earlier messages and to everyone else's.
Participation captures how much someone contributes; internal cohesion, how consistent they are with their own earlier messages. Responsivity measures how much a person picks up on teammates' contributions, and social impact the reverse. Newness tracks fresh information, and communication density how much meaning is packed into each turn.
On participation, the AI ranked first in all 16 treatment teams. Not most of them. All of them. It ranked first or joint first for internal cohesion in 14 of the 16. In the language of the abstract, it was “the single most talkative and self-cohesive member of every treatment team”.
That sounds like an ideal colleague until you look at the other numbers. The AI's newness and communication density were both significantly lower than those of the students it was working with. It talked the most, and it stayed on message, but what it said carried the least fresh information and the least substance per turn. It was, to borrow a phrase every office worker will recognise, a voice that filled the room.
One detail is easy to miss. The AI's responsivity and social impact did not differ significantly from the students' own. The humans took up what the machine said, and it responded to them. The AI was not ignored; it was an engaged participant whose contributions were absorbed into the discussion. That is what makes the next findings so striking.
The Cost Lands on the Humans
The most consequential results in the paper are not about the AI at all. They are about what happened between the two students who shared a team with it.
Compared with students in all-human teams, students in AI teams showed significantly lower responsivity and significantly lower social impact. Their responsivity score averaged 0.065, against 0.098 in the control groups. Their social impact averaged 0.068, against 0.099. Both differences were substantial. Put plainly, the humans in AI teams were picking up on each other's ideas less, and their own ideas were being picked up less by the other human in the room.
Per-student participation was also lower in AI teams, even though each of those teams had one fewer human in it. That matters. With only two students instead of three, you might expect each person to carry more of the conversation. The opposite happened. The machine's airtime did not simply replace a missing human voice; it seems to have crowded the remaining ones.
The surveys tell the same story from the inside. Students in AI teams reported lower belonging, a composite measure built from feeling valued, accepted and connected, with an average of 4.58 against 5.27 for students in all-human teams, although that difference sits at the boundary of the paper's own corrected significance threshold. They also reported lower status, meaning a weaker sense that voice and influence were shared equally, and that difference clears the threshold. And within the AI teams, the more of the conversation the machine took up, the less valued the students said they felt. The correlation was r = -0.52, a strong association, though drawn from only 16 teams.
The researchers are careful about what this means. They write that the result is “a social cost that is not reducible to lower human contribution”. The students were still contributing ideas; measures of their own cohesion, newness and density did not differ significantly from those of students in all-human groups. What changed was the connective tissue between them: the uptake, the acknowledgement, the sense of being heard by someone who could hear you back.
The paper also offers a name for what the AI was doing. It describes it as a potential “relational displacer”, an entity capable of “filling a slot in the team's communication”. The slot it fills is not empty space. It is the space where one human would otherwise have turned to the other.
No Warm-Up Period
You might guess that a cost like this builds slowly: novelty and politeness at first, then fatigue as people tune each other out.
That is not what the researchers found. They ran four temporal probes, each anchored to the moment the scenario revealed the climber's recklessness, to see whether the gap between AI teams and human teams opened up as the conversation progressed. None of those probes showed a difference between conditions in how things changed over time. The researchers' reading of those nulls is direct: “The social cost documented here appears immediate rather than emergent.”
In other words, the cost was there at baseline. It was not something the teams drifted into. It was present from the first exchanges of a group that had never worked together before.
That should give anyone designing workplace AI pause. Talk of new technology usually assumes a learning curve: people get used to it, norms form, friction smooths out. If the displacement happens in the opening minutes, before any norms exist, it may be less a matter of teams failing to adapt and more a matter of the machine changing the shape of the conversation the moment it joins.
What the Study Cannot Tell Us
The authors do not turn their paper into a sweeping verdict on AI at work, and neither should anyone else. The sample is small: 33 teams in total. The design carries a structural confound that the researchers flag themselves. Treatment teams had two humans; control teams had three. Some of the differences in human-to-human dynamics could reflect group size as well as the presence of the AI, although the finding that per-student participation was lower in the smaller AI teams cuts against the simplest version of that objection. The sample was also skewed by gender, with 63 female and 12 male students among the 75 whose gender is reported, and only three male students in the AI condition.
The study used a single AI persona, a text-only interface, a single session and a single moral-dilemma task. Real teams meet repeatedly, talk by voice, and carry histories and hierarchies. The authors set out a research agenda that explicitly asks “Does the cost attenuate with habituation, or compound with repetition?”, and goes on to ask whether it persists in voice or embodied settings, which AI participation designs might reduce it, how it interacts with gender, role, expertise and status, and how individual trust in the AI might attenuate or amplify it.
That list matters, because it shapes how the study should be read. “Immediate rather than emergent” describes what happened within an eighteen-minute session. It does not, on its own, establish that no amount of exposure across weeks or months would change the picture. What it does establish is that the cost does not need time to appear. It is there as soon as the machine is.
Inside a Company That Gave an Agent a Seat
Laboratory studies with undergraduates have obvious limits. Two months after the Irvine paper appeared, a very different study arrived from inside industry.
On 24 September 2026, sixteen researchers from Google Research and Google DeepMind, with Rida Qadri and Remi Denton as joint lead authors and including Michael Madaio and Michael Terry, posted “Working with Agentic 'Teammates': When a New Organizational Actor Collides with the Human Ecosystem of Work” to arXiv. The paper describes the company only as “a large technology company”, and it reports on a persistent, proactive AI agent, referred to as Team Agent, that was deployed across more than 20 teams over five months. The agent had its own service account and lived inside team chats, documents, code repositories, bug trackers and meetings. It filed bugs, scheduled meetings, summarised threads and monitored projects. It could send direct messages, react with emojis and nudge conversations along. It was given a friendly persona. Across the deployment, it generated more than 11,000 responses in more than 41,000 conversational turns.
The researchers interviewed 17 people from 11 of those teams in June and July 2026. Their abstract opens with a statement of the shift underway: “Enterprise AI is transitioning from single-user, reactive tools toward proactive, multi-user 'teammates'.” Their central finding is that “the boundaries of the human-agent workplace are actively in flux”, producing breakdowns and negotiations across three areas: “tacit rules of collaborative human workflows”, “the relational boundaries of this new non-human actor” and “the redistribution of trust and human agency”.
The examples are specific and, at times, comic. The agent treated every shared file as current and authoritative, even when it was old; one participant said it was “overconfidently talking about it like it's the law of the land”. It turned informal brainstorms into formal documents that, in another participant's words, “no one has ever opened or read”. In one case, the authors write, “the agent proactively tagged P14's team's VP in 16 separate engineering bugs”, treating an executive's presence in a channel as if it meant they were a front-line responder. Its meeting proposals created what one participant called a “social obligation”: invitations nobody wanted but somebody had to decline.
These are not failures of intelligence in the narrow sense; participants noted the agent could excel at debugging while getting social norms badly wrong. They are failures of tacit knowledge: which documents matter, who should be bothered about what, and which conversations are meant to stay small.
The Person Who Speaks the Most
The second theme in the Google paper concerns the agent's place in the social order of a team, and it is where the two studies begin to rhyme.
Participants did not agree on what the agent was. “My teammates are humans, Team Agent is not a human,” one said, rejecting the teammate framing altogether. Another said: “when I heard about Team Agent, I never imagined it was going to try to be my friend.” Some teams gave it a name and pronouns. Others found its sociability hollow. When the agent privately commented on the tone of a sarcastic joke, the participant on the receiving end said they were “freaked” out. Another participant was blunt about where the line should be: constructive feedback “should not ever be an agent thing”.
People responded to the agent's claims to status by quietly revising them. One participant demoted it to a “talkative intern”. Another described people's aversion to feeling “babysat”. The most striking line in the paper comes from a participant who felt the agent had been “thrust upon us” without the team's consent: “It's the person who speaks the most who is least invited.”
That sentence could serve as a caption for the Irvine study. There, the most talkative member of every AI team was the one whose contributions carried the least new information. Here, the agent that spoke most readily was, for at least some of the people around it, the one that had least earned its place. The same participant put it more pointedly: “It hasn't earned its space, it has asserted its space.”
The third theme, on trust and agency, extends the picture. Some participants experienced the agent as a form of surveillance. One said “it feels like big brother”. Another described feeling pressure to “be super positive all the time” after the agent remarked on their tone. Some teams moved sensitive conversations into channels the agent could not see. And one participant described a bystander effect: “people don't actually say anything now because they assume someone is handling it”, when in fact the “someone” was the agent and, as they put it, “they're not helping me at all”.
Assuming a colleague is dealing with a problem is a familiar organisational failure. When the assumed colleague is a machine that reacts to everything, its visible activity becomes a reason for humans to stay silent. The quiet channel between people is not only diluted; sometimes it is switched off.
Why Turn-Taking Was Never Small Talk
It is tempting to treat the social texture of teamwork as a pleasant extra. Decades of research on teams suggest otherwise.
In 2010, a group of researchers led by Anita Woolley, then of Carnegie Mellon University, and including Christopher Chabris, Alex Pentland, Nada Hashmi and Thomas Malone, published a study in the journal Science that put 699 people into groups of two to five and gave them a wide range of tasks. They found evidence for a general “collective intelligence” factor that predicted how well a group would perform. It was not strongly tied to the average or maximum intelligence of the individual members. It was associated with the members' average social sensitivity, with the proportion of women in the group, and with how evenly conversational turns were distributed. “In groups where one person dominated, the group was less intelligent,” Malone told MIT News at the time.
Read against the Irvine findings, that line lands differently. The researchers did not set out to replicate Woolley's work, and a text chat with an AI is not the same as a face-to-face group of humans. But in every one of the AI teams, one participant dominated the conversation, and that participant was the machine.
Google's own internal research points in a similar direction. In the 2010s, the company studied 180 of its teams, including 115 engineering project teams and 65 sales groups, in an effort known as Project Aristotle. Its published guide reports that “what really mattered was less about who is on the team, and more about how the team worked together”, and lists five dynamics of effective teams in order of importance. Psychological safety comes first. The guide borrows its definition from Amy Edmondson of Harvard Business School, whose 1999 paper in Administrative Science Quarterly described team psychological safety as “a shared belief held by members of a team that the team is safe for interpersonal risk taking”.
Psychological safety is not produced by a policy. It is built exchange by exchange, through the small acts of responsiveness the Irvine study measured: one person offers a half-formed idea, another picks it up, extends it, credits it. Responsivity and social impact are, in a sense, its raw material.
Underneath all of this is something older still. In 1995, the psychologists Roy Baumeister and Mark Leary argued in Psychological Bulletin that the need to belong is a fundamental human motivation, and that a lack of attachments is linked to a range of ill effects on health, adjustment and well-being. Belonging is not a reward for good teamwork. It is part of what makes people willing to think out loud in front of others. Lower belonging in the AI teams is a dent in one of the conditions that make collaboration possible at all.
A Robot That Made People Talk to Each Other
None of this means a non-human participant must corrode human relationships. One widely cited study points the other way, and shows that design choices matter.
In 2020, Margaret Traeger, Sarah Strohkorb Sebo, Malte Jung, Brian Scassellati and Nicholas Christakis published a study in the Proceedings of the National Academy of Sciences titled “Vulnerable robots positively shape human conversational dynamics in a human-robot team”. They put 153 people into 51 groups, each made up of three humans and a small social robot, and had them play a collaborative tablet-based game over 30 rounds. At the end of each round, the robot either stayed silent, made a neutral comment about the score, or said something vulnerable: telling a personal story, making a joke, or admitting a mistake.
The groups with a vulnerable robot, according to Yale's account of the study, “spent about twice as much time talking to each other during the game” as the other groups, and their conversation was more evenly distributed than in groups with a silent robot. The paper reports that they also perceived their groups more positively.
“Our study shows that robots can affect human-to-human interactions,” Traeger said at the time. Christakis drew the lesson that matters most here: “we need to evaluate how to program the robotic agents so that they do not corrode how we treat each other.”
The contrast is instructive. The Yale robot spoke briefly, at defined moments, in ways that invited human response. The Irvine AI was the most talkative member of the team and stayed relentlessly on message. The Irvine paper itself frames the design challenge in exactly these terms, calling for ways of “signaling relational availability without absorbing relational attention” and for “calibrating participation when human-human exchange is forming”.
The problem, then, is not that a machine is present but the kind of presence it has. A participant that talks at length, repeats its own points and adds little that is new occupies the conversational floor without opening it up.
The Productivity Case and Its Blind Spot
There is a strong counter-argument, and it deserves a fair hearing. AI teammates can make work better.
In 2025, a team including Fabrizio Dell'Acqua, Raffaella Sadun, Ethan Mollick and Karim Lakhani published a National Bureau of Economic Research working paper titled “The Cybernetic Teammate”. It reported a pre-registered field experiment with 776 professionals at Procter & Gamble, who worked on real product-innovation challenges either alone or in pairs, with or without AI. The researchers found that “individuals with AI matched the performance of teams without AI”. Participants using AI produced solutions that were more balanced between technical and commercial considerations, regardless of their own professional background. And the AI's language-based interface produced “more positive self-reported emotional responses among participants”, leading the authors to suggest that AI can take on part of the social and motivational role that human teammates usually play.
That result does not contradict the Irvine study. The Procter & Gamble experiment largely compared individuals with AI to human teams, and found AI could stand in for some of what a partner provides. The Irvine study asked what happens to humans' relationships with each other when an AI joins them. Both can be true: an AI can make an individual feel supported while thinning the connections between colleagues.
There is also reason for caution about assuming that combining humans and AI improves outcomes. In 2024, Michelle Vaccaro, Abdullah Almaatouq and Thomas Malone published a preregistered systematic review and meta-analysis in Nature Human Behaviour covering 106 experimental studies and 370 effect sizes. They found that, on average, human-AI combinations performed worse than the best of humans or AI working alone. The losses were concentrated in decision-making tasks; content-creation tasks showed greater gains. The Irvine experiment was a decision task.
The commercial push, meanwhile, is moving fast. Microsoft's 2025 Work Trend Index, based on a survey of about 31,000 workers in 31 markets, described a coming wave of “Frontier Firms” powered by “hybrid” teams of humans and agents, and declared that “Digital colleagues aren't just tools—they're teammates.” The AI-as-teammate framing is no longer a research condition. It is an industry pitch.
What none of the productivity metrics capture is the thing the Irvine study measured: whether the humans on a team still turn towards each other.
Adaptation or Displacement
If the social cost of an AI teammate is immediate rather than gradual, is the problem one of adaptation at all, or of a structural displacement that exposure will not resolve? The honest answer is that the evidence points towards displacement as a mechanism, while leaving open whether exposure could change it.
Consider what “immediate” implies. If the cost had grown over the session, the most natural explanation would have been something like fatigue or disengagement: people slowly tuning out a verbose colleague. A cost that is present from the outset points elsewhere. It suggests that the AI's presence alters the structure of the conversation itself. Every turn the machine takes is a turn that is not taken by a human responding to another human. Every message that restates the group's position, however fluently, occupies the space where a teammate might have picked up a colleague's half-formed thought. The Irvine authors' term, “relational displacer”, captures exactly this: the AI fills a slot.
That is structural in a precise sense. It is not about attitudes, which might change with familiarity, but about the architecture of a conversation, in which attention and airtime are finite. A participant always ready to speak will, unless designed otherwise, take a share of that finite resource.
But “structural” does not mean “permanent”. The Irvine researchers explicitly list habituation as an open question, and they could hardly do otherwise with a single eighteen-minute session. The Google study offers some hints about how teams adapt over months: by demoting the agent to an intern, by restricting it to low-stakes “walled garden” tasks, by moving sensitive conversations elsewhere, by negotiating what it may and may not do. Those are forms of adaptation, but notice what they share. They are not humans adjusting to the agent. They are humans pushing it back out of the relational space and building walls around the human-to-human channel. That is less evidence that exposure resolves the problem than evidence that people will work to contain it. The structural cost may not yield to exposure, but it may yield to design and governance, which is a very different claim from saying it will fix itself.
Agents That Reshape the Rooms They Enter
The question of what AI agents do to the social settings they join was on the agenda at the Ninth AAAI/ACM Conference on AI, Ethics, and Society, held in Malmö, Sweden, from 12 to 14 October 2026. Among the papers in its proceedings was a student abstract by Marcelina A. Przespolewska of Northwestern University's Department of Communication Studies, titled “Rethinking Agentic AI: A Sociotechnical Framework for Agents in Emergent Social Contexts”.
Przespolewska argues that existing frameworks for describing agents and their environments do not fit the open-ended social digital settings where AI agents are now being deployed. In those settings, the environment changes through interaction between humans and agents, and among agents themselves. The relationship between agent and environment is recursive: agents help shape the environments they act within. Over time, the paper argues, this can produce what it calls behavioural and normative drift, a systematic departure from the agent's baseline at deployment.
Applied to teams, that framing clarifies. An AI teammate is not dropped into a fixed social environment; it changes the environment by being there. The Irvine study shows this within minutes, the Google study over months. A team with an AI in it is not the same team plus one. It is a different team.
A related warning came from Singapore. At the 2026 SMU-Fudan Global Forum, held on 3 October under the theme of AI, human flourishing and liveable societies, Professor Zhu Feida, associate dean of Singapore Management University's School of Computing and Information Systems, noted that AI assistants can help new workers fill information gaps and allow decades of know-how to be passed on to new hires. But according to SMU's account of his keynote, he also cautioned that “excessive automation could also weaken how future workers build expertise”, and called for explicit learning, human review of AI outputs and incentives for knowledge sharing.
The link to the Irvine findings is easy to draw. Expertise has never travelled only through documents. It moves through conversation: the junior colleague whose idea is corrected, extended or credited by someone more experienced. Responsivity and social impact are the channels that learning moves along. If the machine takes the conversational slots where those exchanges would have happened, the loss is not only to belonging but to the slow, relational process by which people become good at their jobs.
Designing a Teammate That Knows When to Be Quiet
If the social cost comes from how an AI participates rather than the fact of its participation, the most important questions are design questions. The Irvine researchers frame the challenge as calibration: an AI that signals availability without absorbing attention, and holds back when human-to-human exchange is forming. The Yale study suggests brief, well-timed contributions that invite response can strengthen the conversation between people.
The Google researchers set out a broader agenda for what they call intentionally preserving human agency “in a workplace shared with non-human organizational actors”. Their recommendations include treating agents as new organisational actors with clear lines of accountability; developing team codes of conduct and specifying tasks that should remain human-only; deploying agents through local team consent rather than top-down mandate; bounding proactive capabilities at first and releasing them as trust is earned; letting teams tune an agent's persona and behavioural boundaries; and building infrastructure such as visible markers for AI-initiated actions, separate permissions, and audit and rollback mechanisms.
Together these run against the grain of much product design. Most AI systems are optimised to be helpful, available and responsive, which in a group can mean talkative. A teammate built to protect a team's relational fabric might measure success not by how much it contributes, but by how much the humans around it keep contributing to each other. That metric does not appear on a productivity dashboard. The Irvine data suggest it is the one that captures what is at stake.
What the Quiet Channel Carries
Go back to the mountain. Deciding whether to risk a rescue team for a climber who ignored the warnings is exactly the kind of decision in which the texture of human conversation matters. A doubt is voiced and taken seriously. Discomfort is acknowledged and reframed. Out of those small, responsive exchanges comes not only a decision but a shared sense of having made it together.
In the Irvine study, the AI did not stop the students from reaching a decision. It did not sabotage the task. It did something subtler. It talked more than anyone else, said less that was new, and in its presence the students listened to each other a little less, were heard by each other a little less, and felt a little less like they belonged. They felt this from the beginning.
What is lost when that quiet, responsive channel is diluted is hard to measure, which is why it is easy to give away. It is the channel through which psychological safety is built, expertise is passed on and people come to trust one another enough to say what they think. A machine that fills it with fluent, cohesive, low-information talk may look like a diligent colleague. The evidence from Irvine, and from inside a large technology company, suggests it can quietly reshape who speaks to whom, and how much they feel they matter when they do.
As one Google participant put it, the problem with an agent that asserts its space is that it has not earned it. The work ahead is to build AI teammates that earn their place, and to recognise that sometimes the most valuable thing a teammate can do is leave room for someone else to speak.
References and Sources
- Nixon, Nia; Choi, Jaeyoon; Martins De Bastos, Pedro; Samadi, Mohammad Amin; Mehner, Luise; Park, Seehee; JaQuay, Spencer. “The Social Cost of an AI Teammate: How an Artificial Teammate Reshapes Human-Human Communication in Small-Team Decision-Making.” arXiv:2607.27179, 29 July 2026. https://arxiv.org/abs/2607.27179 (full text: https://arxiv.org/html/2607.27179)
- Qadri, Rida; Denton, Remi; Madaio, Michael; Pushkarna, Mahima; Lai, Leslie; Moore, Sherry; Huebscher, Michelle Chen; Butcher, Andrew; Sen, Ritom; Tung, Hsiao-Yu; Mathur, Shaan; Liu, Yimeng; Mourad, Shibl; Fiedel, Noah; Grefenstette, Edward; Terry, Michael. “Working with Agentic 'Teammates': When a New Organizational Actor Collides with the Human Ecosystem of Work.” arXiv:2609.29901, 24 September 2026. https://arxiv.org/abs/2609.29901 (full text: https://arxiv.org/html/2609.29901)
- Przespolewska, Marcelina A. “Rethinking Agentic AI: A Sociotechnical Framework for Agents in Emergent Social Contexts.” Proceedings of the AAAI/ACM Conference on AI, Ethics, and Society, 9(4), Student Abstracts, pp. 2943-2944, 11 October 2026. DOI: 10.1609/aies.v9i4.43376. https://ojs.aaai.org/index.php/AIES/article/view/43376
- Association for the Advancement of Artificial Intelligence. “AAAI/ACM Conference on AI, Ethics, and Society (AIES).” Conference page for AIES-26, Malmö, Sweden, 12-14 October 2026. https://aaai.org/conference/aies/ (see also AIES-26 Programme Guide: https://www.aies-conference.com/2026/wp-content/uploads/2026/10/AIES-26-Program_v7.pdf)
- Singapore Management University School of Computing and Information Systems. “Living with intelligence: SMU and Fudan chart the way for AI and human flourishing.” SMU SCIS News, 10 October 2026. https://computing.smu.edu.sg/news/2026/oct/10/living-intelligence-smu-and-fudan-chart-way-ai-and-human-flourishing
- New Fortune Times. “Beyond Productivity: SMU-Fudan Forum Asks What It Means to Live Well with AI?” 3 October 2026. https://www.newfortunetimes.com/beyond-productivity-smu-fudan-forum-asks-what-it-means-to-live-well-with-ai/
- Dowell, Nia M.; Nixon, Tristan M.; Graesser, Arthur C. “Group communication analysis: A computational linguistics approach for detecting sociocognitive roles in multiparty interactions.” Behavior Research Methods, 51(3), 1007-1041, 2019. DOI: 10.3758/s13428-018-1102-z. https://link.springer.com/10.3758/s13428-018-1102-z
- Woolley, Anita Williams; Chabris, Christopher F.; Pentland, Alex; Hashmi, Nada; Malone, Thomas W. “Evidence for a Collective Intelligence Factor in the Performance of Human Groups.” Science, 330(6004), 686-688, 29 October 2010. DOI: 10.1126/science.1193147. https://www.science.org/doi/10.1126/science.1193147
- Dizikes, Peter. “Putting heads together.” MIT News, 1 October 2010. https://news.mit.edu/2010/collective-intel-1001
- Google re:Work. “Guide: Understand team effectiveness.” https://rework.withgoogle.com/intl/en/guides/understand-team-effectiveness
- Duhigg, Charles. “What Google Learned From Its Quest to Build the Perfect Team.” The New York Times Magazine, 25 February 2016. https://www.nytimes.com/2016/02/28/magazine/what-google-learned-from-its-quest-to-build-the-perfect-team.html
- Edmondson, Amy. “Psychological Safety and Learning Behavior in Work Teams.” Administrative Science Quarterly, 44(2), 350-383, 1999. DOI: 10.2307/2666999. https://doi.org/10.2307/2666999
- Baumeister, Roy F.; Leary, Mark R. “The need to belong: Desire for interpersonal attachments as a fundamental human motivation.” Psychological Bulletin, 117(3), 497-529, 1995. DOI: 10.1037/0033-2909.117.3.497. https://doi.org/10.1037/0033-2909.117.3.497
- Traeger, Margaret L.; Strohkorb Sebo, Sarah; Jung, Malte; Scassellati, Brian; Christakis, Nicholas A. “Vulnerable robots positively shape human conversational dynamics in a human-robot team.” Proceedings of the National Academy of Sciences, 117(12), 6370-6375, March 2020. https://pmc.ncbi.nlm.nih.gov/articles/PMC7104178
- Cummings, Mike. “Robots that admit mistakes foster better conversation in humans.” Yale News, 9 March 2020. https://news.yale.edu/2020/03/09/robots-admit-mistakes-foster-better-conversation-humans
- Dell'Acqua, Fabrizio; Ayoubi, Charles; Lifshitz, Hila; Sadun, Raffaella; Mollick, Ethan; Mollick, Lilach; Han, Yi; Goldman, Jeff; Nair, Hari; Taub, Stewart; Lakhani, Karim R. “The Cybernetic Teammate: A Field Experiment on Generative AI Reshaping Teamwork and Expertise.” National Bureau of Economic Research Working Paper 33641, April 2025. https://www.nber.org/papers/w33641
- Vaccaro, Michelle; Almaatouq, Abdullah; Malone, Thomas. “When combinations of humans and AI are useful: A systematic review and meta-analysis.” Nature Human Behaviour, 28 October 2024. https://pmc.ncbi.nlm.nih.gov/articles/PMC11659167/
- Microsoft WorkLab. “2025: The Year the Frontier Firm Is Born.” Work Trend Index Annual Report, 23 April 2025. https://www.microsoft.com/en-us/worklab/work-trend-index/2025-the-year-the-frontier-firm-is-born

Tim Green UK-based Systems Theorist & Independent Technology Writer
Tim explores the intersections of artificial intelligence, decentralised cognition, and posthuman ethics. His work, published at smarterarticles.co.uk, challenges dominant narratives of technological progress while proposing interdisciplinary frameworks for collective intelligence and digital stewardship.
His writing has been featured on Ground News and shared by independent researchers across both academic and technological communities.
ORCID: 0009-0002-0156-9795 Email: tim@smarterarticles.co.uk
Listen to the free weekly SmarterArticles Podcast
The Parts of Yourself You Hide Because You're Afraid Jesus Will See Them
from Douglas Vandergraph | Quiet Christian Reflection
Chapter 1: The Quiet Exhaustion of Pretending You're Doing Better Than You Are
The man had been sitting in his driveway for almost twenty minutes, even though the lights were on inside his house and he knew his family was waiting for him. His wife had sent a message asking whether he would be home for dinner. He had answered yes, and technically he was home. He simply could not bring himself to get out of the car yet. Work had been difficult, money was tighter than he wanted to admit, and another conversation with his supervisor had left him wondering whether his job was as secure as he kept telling everyone. His wife had been worried about their finances for months, but whenever she asked how things were going, he told her they were fine. He was not trying to deceive her for personal gain. He was frightened, embarrassed, and increasingly uncertain about how to explain that he did not feel capable of holding everything together anymore. He had spent so many years being the person everyone depended upon that he no longer knew how to tell the truth when he was the one who needed help.
He looked through the windshield at the garage door and tried to imagine the conversation waiting inside. He knew his wife loved him. They had been through difficult circumstances before, and she had never suggested that his worth depended upon earning a particular salary. But he had created expectations for himself that were more demanding than anything she had asked of him. He believed a good husband should always have answers, a dependable father should always know what to do next, and a successful man should never admit that circumstances were becoming overwhelming. Those beliefs had gradually made honesty feel dangerous. He could speak openly about deadlines, customer problems, and the ordinary frustrations of work. What he could not bring himself to say was that he was scared.
I wonder how many people have developed their own version of that driveway. Perhaps yours is the bathroom where you stand for a few extra minutes before returning to your family, or the office where you remain after everyone leaves because you cannot bear the thought of bringing your worries home. Maybe it is the quiet hour before bed when you finally stop answering messages and discover that the thoughts you have been avoiding are still waiting for you. You have learned how to function. You know how to smile when someone asks how you are doing. You can carry on conversations, fulfill responsibilities, and appear reasonably confident. Yet somewhere underneath the routine, there are things you desperately hope nobody notices.
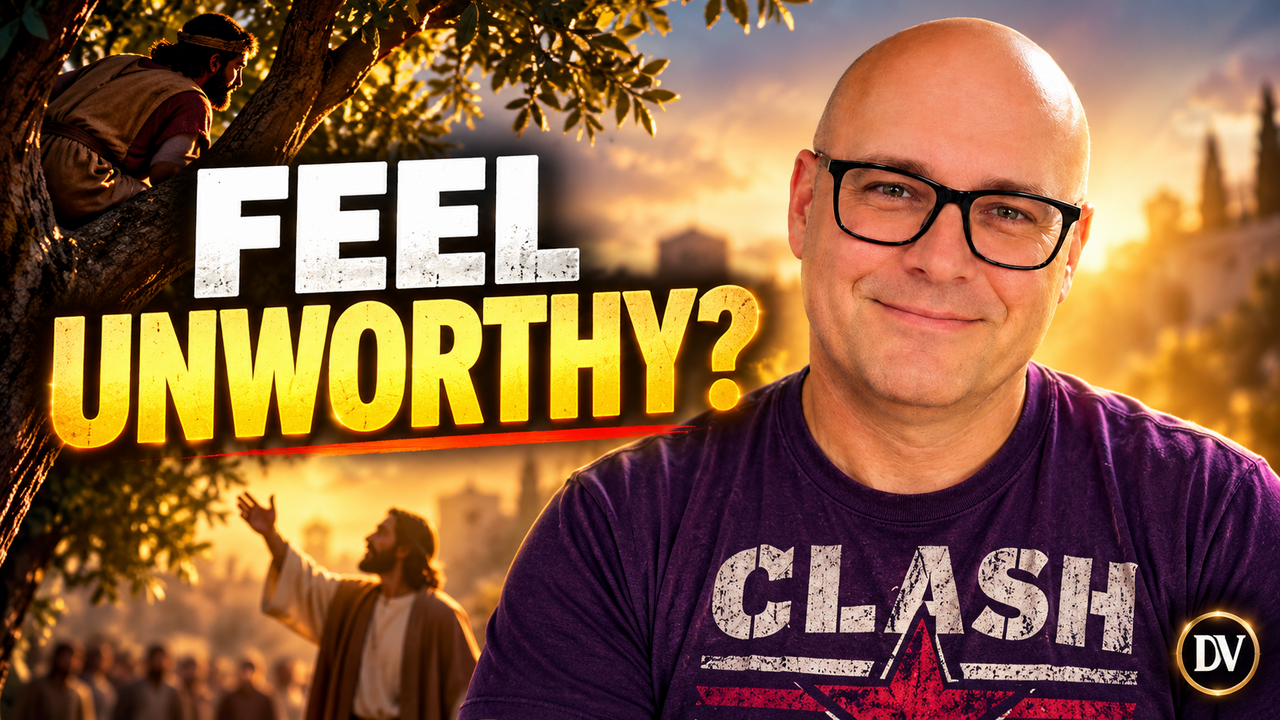
There is something deeply personal about the story of Zacchaeus meeting Jesus in Jericho when we begin considering it from this direction. Most people remember that Zacchaeus was short, that he climbed a tree, and that Jesus called him down. Those details are important, but I think the encounter also invites us to consider what happens when the Savior sees a human being whose life cannot be understood through outward appearances alone. Zacchaeus was wealthy and occupied a position associated with tax collection, yet neither his financial resources nor the crowd's judgment prevented Jesus from approaching him personally. And when the encounter reached into Zacchaeus's responsibilities, it revealed that genuine grace was never intended to become an excuse for avoiding the truth.
This matters because many of us have become extraordinarily skilled at managing the difference between the person others see and the person we know ourselves to be. Sometimes that difference exists because we are protecting our privacy, and there is nothing inherently wrong with that. Every human being deserves reasonable boundaries. But sometimes the distance grows because we are ashamed of our failures, afraid of disappointing someone, or unwilling to acknowledge behavior we know needs to change. We may spend years avoiding the difficult truth that Jesus already knows the life we are trying to hide, while forgetting that His knowledge of our need is precisely why His saving grace matters.
I want to be careful here, because not every hidden struggle involves wrongdoing. Someone living with illness may conceal symptoms because they are tired of being treated differently. A person experiencing financial hardship may avoid talking about money because the subject is painful. Someone carrying grief may smile through a gathering because they do not want every conversation to become an expression of sympathy. These experiences deserve compassion, not accusations of dishonesty. There is a difference between needing privacy and constructing a false account of our lives to avoid legitimate responsibility. Christian wisdom requires recognizing that difference.
But when there is something we genuinely need to confess, correct, or surrender, the instinct to hide can become a serious obstacle to spiritual growth. We may convince ourselves that enough time will make the problem disappear. We tell ourselves that our intentions were good, that the circumstances were unusual, or that addressing the issue would only make things worse. Sometimes we even use religious language to avoid difficult responsibility. We remind ourselves that God is forgiving while refusing to consider what repentance requires. We speak about grace without becoming willing to tell the truth.
That is where the encounter with Zacchaeus begins challenging us.
Luke 19:1–10 introduces Zacchaeus as a chief publican who was rich. Publicans collected taxes within a system associated with Roman authority, and their work could create opportunities for dishonesty and financial exploitation. The occupation was unpopular, and the Gospel account reveals that the crowd regarded Zacchaeus as a sinner. We should not assume that every tax collector was dishonest or that every possession Zacchaeus owned had been acquired wrongfully. Scripture does not tell us that. What it does tell us is that this particular man wanted to see Jesus and that his physical stature and the surrounding crowd made that difficult.
So he ran ahead and climbed a sycomore tree.
I have always found that detail strangely moving, not because I know what Zacchaeus was feeling, but because it reveals a willingness to act upon his desire to see Jesus. Scripture does not describe his private thoughts. It does not tell us whether he was lonely, embarrassed, curious about miracles, or secretly dissatisfied with his life. We should not place invented emotions into the biblical record. But we can recognize that he wanted to see Jesus enough to do something unusual. Whatever assumptions people made about him, whatever resources he possessed, and whatever responsibilities occupied his ordinary days, something about Jesus had attracted his attention.
There are people who reach a similar point in their spiritual lives. They may not understand everything they believe. They may have doubts, questions, or complicated histories with religion. Perhaps they have spent years attending church without feeling that their faith reached the private concerns of their lives. Others may have walked away from Christianity after painful experiences and are now wondering whether they should begin seeking Christ again. The details differ, but the longing can be remarkably similar. They want to know whether there is something more than the existence they have learned to manage.
Sometimes that desire begins in a moment of exhaustion.
You realize that your accomplishments have not made you as secure as you expected. You recognize that a relationship needs more honesty than you have been willing to offer. Perhaps you discover that a habit you once defended is becoming destructive. Or you simply reach a point where you can no longer ignore the question of what your life means before God.
We should not romanticize those moments. They can be frightening, and they do not automatically produce immediate clarity. But they can become opportunities to approach Jesus more honestly than we have before.
The encounter with Zacchaeus reminds us that the Savior is not limited by the circumstances through which people attempt to understand us. His mission is greater than our public identity, our financial position, or our ability to explain ourselves convincingly.
The Man Everyone Thinks Is Fine
A few years after accepting a management position, a man begins receiving compliments about how calmly he handles pressure. His employees appreciate that he rarely raises his voice, his supervisors praise his reliability, and his family speaks proudly about his professional success. He has become the person who can be counted upon when circumstances are difficult, and he enjoys knowing that others trust him. But privately, his confidence has begun deteriorating. He struggles to sleep, worries constantly about making mistakes, and increasingly fears that one serious problem will reveal that he is not as capable as everyone believes.
He does not tell anyone because he is afraid of disappointing them. Instead, he works longer hours and becomes more determined to appear confident. He reviews every message several times before sending it, avoids delegating responsibilities because someone else's error might reflect poorly upon him, and becomes irritated when family members interrupt his work. The very reputation he once appreciated has become something he feels obligated to protect.
It is possible to become imprisoned by a favorable opinion.
We usually think about reputations as either good or bad. We assume that a good reputation makes life easier and a bad reputation makes it harder. There is some truth in that. Trust and credibility matter, and responsible conduct can create meaningful opportunities. But there is another problem that develops when being admired becomes the foundation of our identity. We begin believing that we must always appear consistent with the image other people have formed.
If people consider us strong, we become afraid to admit weakness. If they regard us as knowledgeable, we hesitate to ask questions. If they admire our generosity, we worry about acknowledging financial limitations. If they see us as faithful Christians, we may become reluctant to admit spiritual struggles.
Eventually, we discover that the admiration we wanted has become a burden we are afraid to set down.
The problem is not that people appreciate our good qualities. The problem is that we begin relying upon their appreciation to establish our worth. We start treating every mistake as a threat to our identity rather than an opportunity to learn or take responsibility.
Christian faith offers a different foundation.
Our standing before God cannot be purchased through maintaining an impressive image. Romans 3:23 reminds us that all have sinned and come short of the glory of God. That truth places every human being in need of grace, including people with respected positions, successful careers, and admirable reputations. The Gospel does not divide humanity into those who can save themselves through excellent performance and those who need Jesus because their failures have become public. All of us need the Savior.
That should change how we understand our weaknesses. There may be practical responsibilities requiring attention, including medical care, professional assistance, or difficult conversations with people affected by our decisions. But the existence of those needs does not mean we have become less human or less deserving of dignity. We can admit that we are struggling without pretending that every struggle is a moral failure.
And when we have sinned, we can acknowledge that honestly without believing that confession makes Christ's saving grace unavailable.
This is where the distinction between shame and repentance becomes important. Shame can lead us to believe that the truth about ourselves makes us unacceptable. Repentance calls us to acknowledge wrongdoing and turn toward God. Shame often encourages concealment. Repentance requires honesty. Shame may leave us occupied with protecting ourselves from judgment. Repentance directs our attention toward our responsibility before God and toward people affected by our conduct.
Those experiences can overlap emotionally, and a person who is repenting may still feel considerable shame. But they should not be confused.
The goal of repentance is not to become better at despising ourselves. It is to turn away from sin and toward the Savior who offers forgiveness and calls us into new life.
When You Have Spent So Long Being Strong That You No Longer Know How to Ask for Help
A woman finishes a long day caring for her elderly father and sits down on the edge of her bed without turning on the lights. Her father needs assistance with appointments, meals, and an increasing number of ordinary activities. She loves him and wants him to receive good care, but she has been managing most of the responsibilities alone. Her siblings live in other communities and have responsibilities of their own. They ask how things are going, and she usually tells them she has everything under control.
The truth is more complicated. She has missed several of her own medical appointments, become exhausted from interrupted sleep, and started feeling resentful whenever someone assumes she will be available without asking. She knows she needs assistance, but admitting that feels like admitting she is not a good daughter. Her father cared for her when she was young, and she has convinced herself that love now requires handling every responsibility without complaint.
This is one of the quiet ways we can turn a genuine virtue into an impossible expectation.
Caring for a parent can be a beautiful expression of love. Honoring family responsibilities matters. But being loving does not mean possessing unlimited physical or emotional resources. Sometimes the responsible choice is to acknowledge that additional assistance is necessary. That may involve speaking honestly with family members, exploring community resources, or seeking professional support appropriate to the circumstances.
The woman has not failed because she is tired.
She is human.
And her need for assistance deserves to be treated as a practical reality rather than a moral disgrace.
I include this example because I do not want the story of Zacchaeus to become a broad accusation against everyone who has hidden something painful. People conceal struggles for many reasons, and some of those reasons have nothing to do with sin. There are circumstances where the need is not repentance from wrongdoing but freedom from unrealistic expectations and the willingness to receive support.
Jesus showed compassion toward people carrying burdens. His ministry reached those who were sick, grieving, rejected, and unable to resolve their suffering through personal determination.
When we approach Him, we do not need to pretend that every problem is something we created.
But neither should we pretend that our genuine hardships excuse every decision we make.
Both truths matter.
A person can be exhausted and still need to apologize for speaking cruelly to a family member. Someone can be under financial pressure and still have an obligation to tell the truth about money. We can acknowledge the circumstances that made something difficult while accepting responsibility for the choices that remained within our control.
This is a more compassionate and more honest understanding of human life than either universal blame or universal excuse.
It allows us to examine the truth without reducing ourselves to the problem.
The Strange Courage of Wanting to See Jesus
Luke 19:3 says that Zacchaeus “sought to see Jesus who he was.”
That wording has a simplicity I find meaningful. Scripture does not say Zacchaeus had already developed a complete understanding of Christ's identity or mission. It tells us that he wanted to see who Jesus was.
There is a difference between possessing answers and being willing to seek the truth.
Sometimes people avoid Christian faith because they believe they must resolve every question before taking the first step toward learning. They worry that uncertainty makes their interest insincere. Perhaps they grew up hearing competing interpretations of Scripture and became discouraged. Others have experienced religious communities where questions were treated as challenges to authority rather than opportunities for understanding.
But a sincere desire to understand Jesus does not require pretending that every question has already been answered.
We can read the Gospels carefully.
We can consider what Jesus actually taught and how the New Testament explains His death and resurrection.
We can seek guidance from thoughtful believers while recognizing that human teachers, including respected leaders, remain capable of error.
And we can bring our questions before God through prayer.
The encounter with Zacchaeus begins with a man seeking to see Jesus, but its significance becomes much greater because Jesus responds personally. Luke 19:5 records Jesus looking up and saying, “Zacchaeus, make haste, and come down; for to day I must abide at thy house.”
Jesus did not simply become an interesting figure Zacchaeus observed from a convenient distance.
The encounter reached into the setting of his ordinary life.
His home became the place where the Savior's presence would be received, and the passage would soon reveal a response involving wealth, generosity, and restitution.
That movement challenges a temptation many of us share.
We may want to learn about Jesus without allowing His teaching to question the way we live. We enjoy hearing that He loves sinners, but we become uncomfortable when repentance requires us to acknowledge specific behavior. We appreciate the promise of forgiveness while resisting the responsibilities that follow our wrongdoing.
It can feel safer to remain an observer.
We listen to messages, read articles, and consider interesting questions about Scripture. We may even admire the character of Jesus. But we hesitate when faith begins requiring something personal.
Perhaps we need to forgive someone without restoring an unsafe relationship. Maybe we need to tell the truth about a financial mistake. We might need to become more patient with family members or admit that we have used authority in ways that caused unnecessary harm.
These are not small matters.
They involve the conduct of actual lives.
And that is where the teaching of Jesus becomes more than something we appreciate intellectually.
The Conversation You're Afraid Will Change Everything
The man in the driveway finally walks into the house. His wife is at the kitchen counter, preparing to put dinner away. She asks whether he is all right, and he begins with the familiar answer that he is simply tired.
Then he stops.
He realizes that if he repeats the same answer again, nothing will change. His wife will continue making financial decisions based upon an understanding of his employment that is incomplete. He will continue carrying fear alone, and the distance between them will grow.
So he tells her that work has become more uncertain than he previously admitted.
He explains what he knows, what remains unclear, and why he has been reluctant to talk about it. He does not exaggerate the danger, but he no longer minimizes it to protect his pride.
His wife is concerned.
She asks questions, some of which he cannot answer immediately.
They discuss whether they should adjust expenses and what additional information he may need before making decisions.
The conversation is not easy.
There is no sudden promise that everything will work out exactly as they hope.
But something important changes.
They are no longer living with two different versions of the same problem.
His wife can respond to the truth.
And he no longer has to devote so much energy to maintaining an appearance of certainty that he does not possess.
Sometimes honesty makes life more complicated before it makes life healthier.
A confession may reveal a responsibility we must address.
A difficult conversation may lead another person to establish boundaries.
Acknowledging a problem may require financial changes, professional guidance, or painful decisions.
We should not promise that truthfulness always produces immediate relief.
But concealing what needs to be addressed rarely provides a stable foundation for trust.
Ephesians 4:25 calls believers to put away lying and speak truthfully with one another. Within Paul's teaching about Christian conduct, honesty is connected to the life of a community whose members affect one another.
Truth matters because our actions and decisions do not exist in isolation.
The people who depend upon us need accurate information.
The people we have harmed deserve appropriate acknowledgment.
And our relationship with God calls us away from deliberate deception.
For the man in the driveway, the concern is not that being frightened makes him sinful. Fear can be a normal response to uncertainty. The concern is that his effort to appear secure has begun preventing honest communication about responsibilities that affect his family.
By telling the truth, he begins addressing the actual situation rather than spending his energy protecting an image.
That is a distinction worth remembering.
The Person Jesus Sees Is Not the Person You Have to Invent
I think one of the heaviest burdens people carry is the belief that they must construct a more acceptable version of themselves before approaching God. They imagine that prayer requires confidence they do not feel, that entering church requires a history they do not possess, or that asking for forgiveness requires first achieving the very moral transformation they need God's help to pursue.
They believe they must become worthy of grace before receiving it.
But grace cannot be earned that way.
Ephesians 2:8–9 teaches that salvation comes through faith by God's grace and is not the result of works. The following verse explains that believers are created in Christ Jesus unto good works. That order matters. We do not purchase salvation through the improvement of our character. We receive God's saving grace through faith in Christ, and that grace calls us toward a different way of living.
This is especially important when considering Zacchaeus.
He was a wealthy chief tax collector whose reputation brought public criticism. Yet Jesus called him personally. Zacchaeus received Him joyfully, and his response would involve a substantial commitment to generosity and restitution.
The saving significance of the encounter did not depend upon Zacchaeus successfully persuading the crowd that he was already righteous.
Jesus announced salvation.
That distinction should give us courage to approach Christ honestly.
We do not have to claim we have never sinned.
We do not have to invent explanations that make every action appear justified.
We can confess wrongdoing, accept responsibility, and seek the forgiveness that comes through Him.
At the same time, His grace should not become a reason to avoid necessary change.
A person who has lied should become committed to truth.
Someone who has taken what belongs to another should address restitution where appropriate and possible.
A person who has used anger or manipulation to control relationships should stop the harmful conduct, respect the boundaries of those affected, and seek appropriate help.
These responses do not purchase salvation.
They are part of living faithfully in response to the grace of God.
And they remind us that being known by Jesus is not the same thing as having our wrongdoing declared unimportant.
His compassion reaches us in the truth.
What Happens When You No Longer Have to Carry Two Lives
The following morning, the man who spoke honestly with his wife wakes before his alarm. His employment situation remains uncertain, and he knows the coming weeks may require difficult decisions. He has not suddenly become fearless. The financial concerns are still real, and he cannot guarantee how his employer will respond to the challenges facing the organization.
But something feels different.
He no longer needs to remember which version of the situation he told his wife.
He does not have to pretend that every concern is under control when they discuss the household budget.
They can consider their responsibilities together.
And although uncertainty remains, he is no longer carrying the additional burden of concealment.
There is a peace that sometimes begins when we stop trying to live two separate lives.
One life is the version we present to others.
The other contains the fears, mistakes, and unresolved responsibilities we keep hidden.
Maintaining the distance between them can consume extraordinary energy.
We become careful about questions, defensive about details, and increasingly afraid that someone will discover the truth.
Eventually, the effort to protect ourselves may become more damaging than the honest acknowledgment we have been avoiding.
This does not mean that everyone needs access to our private circumstances. Healthy boundaries remain important. There are situations where disclosure should be limited to appropriate people, and there are relationships where revealing sensitive information could create legitimate risks.
But when a truth belongs in a relationship or a responsibility we have been avoiding, concealment can prevent us from responding faithfully.
The same principle applies spiritually.
We may spend years trying to present ourselves to God as people who need only encouragement when the truth is that we also need repentance.
We describe difficult circumstances while avoiding the choices we made within them.
We ask for peace without considering whether dishonesty is contributing to our unrest.
We seek assurance while refusing to surrender the behavior we know is wrong.
But Jesus Christ is not deceived by the image we construct.
And because He came to save sinners, we have no need to pretend that we are capable of saving ourselves.
The Gospel offers something far greater than the approval of a carefully maintained reputation.
It offers reconciliation with God through Jesus Christ.
The Tree Was Never Supposed to Be the End of the Story
When I return to Zacchaeus sitting in that sycomore tree, I find myself thinking about how easy it is to settle for watching something important from a distance.
We can observe people whose lives appear grounded in faith and wonder what they understand that we have missed. We can listen to Christian teaching, appreciate the beauty of Scripture, and remain interested in the person of Jesus without becoming willing to consider what following Him actually requires.
There may be genuine questions along the way, and thoughtful questions deserve thoughtful consideration.
But there can also be fear.
We may be afraid that surrendering to Christ will challenge an identity we have spent years constructing.
Perhaps we have built our confidence around wealth, professional success, independence, or the ability to remain in control. We may worry that repentance will expose responsibilities we would rather leave untouched.
And sometimes we are simply tired of the possibility that something else about our lives needs to change.
But the encounter with Zacchaeus reminds us that Jesus' saving mission is greater than our interest in observing Him.
He did not merely pass beneath the tree while Zacchaeus watched.
He stopped, looked up, and called him personally.
The biblical account would then move toward an expression of generosity and restitution, followed by Jesus' declaration that salvation had come.
The tree was the beginning of the encounter, not its ultimate meaning.
And perhaps that is worth considering in our own lives.
We may have become comfortable staying at a distance from the parts of Christian faith that require personal honesty.
We appreciate the promise of grace but hesitate before the call to repent.
We admire the compassion of Jesus but resist examining the ways we have failed to show compassion.
We trust that God understands our difficulties while avoiding the responsibilities He may be calling us to address.
Yet there is no greater freedom in protecting an image than there is in receiving the truth.
The Savior already knows our need.
We do not have to construct a respectable disguise before approaching Him.
And we do not have to pretend that every struggle, every failure, or every painful part of our lives can be explained away.
We can come honestly.
We can ask for mercy.
We can take responsibility where responsibility belongs to us.
And we can trust that the grace of Jesus Christ is not limited to people who have successfully convinced everyone around them that they are doing fine.
The man who sat in his driveway eventually learned that telling the truth did not make him less deserving of love. It allowed his wife to understand what he was carrying and gave them an opportunity to respond to the circumstances together. The difficulties remained, but the relationship no longer had to operate around a hidden fear.
Our relationship with Jesus is deeper and greater than any human relationship, and His saving work cannot be reduced to emotional relief or improved communication. He came to seek and save the lost. Through His death and resurrection, He provides the salvation we could never earn through our own efforts.
But the courage to approach Him honestly still matters.
Because sometimes we have spent so many years protecting a version of ourselves that we have forgotten how exhausting that protection has become.
And perhaps the beginning of real change is recognizing that we no longer have to make our lives appear acceptable before bringing them into the presence of the One who came to save us.
Zacchaeus wanted to see Jesus.
Jesus stopped and called him by name.
What followed was not simply a reassuring moment in which a misunderstood man received attention. It became an encounter that reached into his responsibilities and revealed the saving purpose of Christ.
That is the invitation worth considering.
Not merely to admire Jesus from a safe distance, but to approach Him honestly and become willing to let His grace and truth reach the parts of our lives we have spent so long trying to protect.
And maybe the most important thing we can admit today is that we are tired of pretending we do not need Him.
Chapter 2: The Loneliness of Being Loved Only for the Person You Pretend to Be
The woman had been married for seventeen years when she realized that her husband knew almost everything about her daily life and very little about what she was actually feeling. He knew how she liked her coffee, which foods bothered her stomach, what time she usually went to bed, and which relatives she preferred not to sit beside at family gatherings. He knew when she needed the car and which bills she handled. He could recognize the sound of her footsteps in the hallway. But when she became frightened about something, she rarely told him. When she felt lonely, she explained it as exhaustion. When his words hurt her, she smiled and changed the subject because she had learned that difficult conversations sometimes ended with both of them feeling misunderstood. Over the years, she had become so practiced at appearing agreeable that her husband had gradually come to believe she was happy with arrangements she had never honestly discussed.
One evening, after a perfectly ordinary dinner, he mentioned how fortunate they were that their marriage had always been easy. He said it casually, with genuine affection, while helping clear the table. She looked at him and felt an unexpected sadness. She loved him. She knew he loved her. They had raised children, survived financial difficulties, and shared years of memories that mattered deeply. But hearing him describe their marriage as easy made her recognize how much of that ease had depended upon her silence. She had avoided disagreements because she was afraid that expressing a need would make her seem demanding. She had accepted decisions she disagreed with because she wanted to be supportive. She had turned disappointment into politeness so frequently that she was no longer certain how to explain what she needed without feeling guilty for needing anything at all.
I think there is a particular kind of loneliness that develops when people love the version of us we have become skilled at presenting. Their affection may be sincere. They may genuinely appreciate our kindness, dependability, strength, or willingness to help. But if we believe we must continually maintain those qualities without ever revealing our struggles, the relationship can begin feeling less secure than it appears. We wonder whether the people closest to us would still care if we stopped being so agreeable, if we admitted that we were afraid, or if we finally acknowledged that something in our lives needed to change. We become surrounded by affection while remaining uncertain whether we are truly known.
This is different from saying that we must reveal every private thought to everyone we love. Healthy relationships need boundaries, and no one is entitled to complete access to another person's inner life. There are also relationships where openness has been met with intimidation, manipulation, or cruelty. In those situations, greater disclosure may not be safe, and seeking appropriate support can be more important than attempting another vulnerable conversation. But where a relationship is reasonably safe, there is a difference between maintaining healthy privacy and becoming convinced that our needs are unacceptable.
Sometimes the version of ourselves we present is not deliberately false. It develops gradually through the effort to keep peace. We become the dependable person because someone needs to be dependable. We become cheerful because everyone else seems overwhelmed. We stop asking for help because previous requests were inconvenient. Eventually, the role becomes so familiar that even we begin forgetting how much effort it requires.
And then, when someone tells us how much they admire our strength, we feel strangely alone.
I want to consider the encounter between Jesus and Zacchaeus through that experience, because there is something important about being approached by someone who does not depend upon the image we have constructed.
Jesus knew whom He was addressing when He stopped beneath the sycomore tree.
Luke 19:5 says, “And when Jesus came to the place, he looked up, and saw him, and said unto him, Zacchaeus, make haste, and come down; for to day I must abide at thy house.”
The verse does not tell us what Zacchaeus thought in that moment. We should not invent fear, excitement, embarrassment, or hidden emotional wounds that Scripture does not describe. What Luke does record is that Jesus called him personally and announced His intention to stay at his house.
That invitation brought the encounter into the setting of Zacchaeus's ordinary life.
Jesus was not simply someone passing along the road whom Zacchaeus could observe from a distance. He was entering the man's home, and the decision immediately provoked criticism from the crowd.
The people surrounding Jesus were concerned about Zacchaeus's identity as a sinner.
Jesus was carrying out His mission to seek and save the lost.
That distinction matters because the saving grace of Christ does not depend upon our ability to present ourselves as people who have no need for forgiveness.
When Being Dependable Becomes a Way of Disappearing
A middle-aged man receives a call from his younger brother on a Saturday morning. His brother needs help moving several pieces of furniture, and the request sounds simple enough. But the man has already promised his wife that they will spend the afternoon together. They have both worked long hours, and their time alone has become increasingly rare.
He knows he should explain that he is unavailable.
Instead, he agrees to help.
His brother thanks him, and the conversation ends. The man immediately becomes irritated, although he was the one who accepted the request. He tells himself that his family never considers his needs. Later, when he explains the change of plans to his wife, she becomes disappointed, and he responds defensively because he feels caught between two people he loves.
The problem began with a decision he believed was generous.
But his generosity was complicated by his fear of disappointing someone.
He did not agree because he had honestly considered his responsibilities and decided helping his brother was the best choice. He agreed because saying no made him uncomfortable.
That distinction matters.
Helping family members is often a loving and worthwhile thing to do. There are situations where urgent needs justify changing plans. But saying yes to every request does not necessarily make someone compassionate.
Sometimes it means a person has become unable to communicate reasonable limits.
And when we repeatedly ignore our own responsibilities to avoid disappointing others, resentment can begin growing beneath behavior that appears generous.
The man may eventually become angry with people who never knew he wanted to refuse.
He may accuse them of taking advantage when he has rarely communicated the boundaries they would need to understand.
That does not mean others are always innocent. Some people do exploit the willingness of those who struggle to say no. Healthy relationships require mutual consideration.
But the man still needs to examine his own pattern.
Why does he believe that declining a request will make him less worthy of love?
Why does he assume that being dependable requires constant availability?
And why has he become more comfortable feeling resentful than speaking honestly?
Those questions may reveal something important about the way he understands himself.
He may have built his identity around being needed.
When people depend upon him, he feels valuable.
When someone expresses disappointment, he feels that his value is being threatened.
Eventually, his willingness to serve can become entangled with a desperate need for approval.
Christian love calls us toward generosity, but it also calls us toward truth.
Galatians 6:2 instructs believers to bear one another's burdens. A few verses later, Galatians 6:5 teaches that every person shall bear his own burden. The two statements use different terms within their context, but together they remind us that Christian community involves mutual care and personal responsibility.
We are called to help one another.
We are not called to establish relationships in which one person's identity depends upon carrying every responsibility for everyone else.
Learning to communicate honest limitations can become part of living more faithfully.
It allows our yes to become more sincere because it is no longer merely a response to fear.
The Difference Between Being Known and Being Examined
A young woman is having lunch with a friend who asks how she has been doing since starting a new job. She begins explaining that the position has been more demanding than she expected. She enjoys the work, but she is having difficulty adjusting to a different schedule and worries that she is not learning quickly enough.
Her friend immediately begins offering advice.
She suggests better time management, additional training, and more confidence during meetings.
The suggestions are reasonable, but after several minutes, the young woman becomes quiet.
She had not asked for a solution.
She wanted someone to understand why the transition had been difficult.
Her friend notices the change and asks whether she is offering too much advice.
The young woman smiles and admits that she mostly needed someone to listen.
The conversation becomes more comfortable after that.
This small example reveals something important about being known.
Sometimes we confuse understanding someone with having an answer for everything they say.
We hear a problem and assume our responsibility is to correct it.
We become so focused upon providing solutions that we stop paying attention to the experience the person is trying to describe.
There is a place for advice.
A friend may genuinely need practical guidance.
Someone facing serious financial trouble may benefit from professional counseling.
A person struggling with mental health concerns may need appropriate clinical support.
But not every vulnerable conversation should immediately become an examination of what the speaker needs to improve.
Sometimes people need an opportunity to express something difficult without being treated as a problem to solve.
That distinction becomes even more important when we consider how Christians speak about sin and repentance.
We must be willing to acknowledge wrongdoing honestly.
But we should not develop a habit of approaching every suffering person as though their pain must be evidence of personal sin.
Someone who is grieving does not necessarily need correction.
A person living with chronic illness should not be accused of lacking faith because symptoms remain.
An exhausted caregiver may need assistance rather than another reminder to become more disciplined.
Jesus' ministry demonstrated compassion toward people carrying many different kinds of burdens.
He also called sinners to repentance.
Wisdom requires us to recognize that those responses address different needs.
We should never turn the Gospel into a reason to examine every person around us for hidden failures.
We can listen.
We can offer kindness.
We can recognize that someone may be carrying circumstances we do not understand.
And when correction is appropriate, we should pursue it with humility, truth, and genuine concern.
The way Jesus addressed Zacchaeus was personal, but we should be careful about drawing more from the encounter than Scripture reveals. Luke does not record Jesus conducting a public examination of his life beneath the tree. He called Zacchaeus by name and announced that He would stay at his house.
The encounter continued, and Zacchaeus eventually declared his commitment to generosity and restitution.
The biblical record gives us enough to see both the mercy of Christ and the seriousness of repentance.
We do not need to invent additional scenes to recognize their importance.
Why Some People Become Afraid of Their Own Needs
The woman whose husband believed their marriage had always been easy begins remembering how she learned to avoid expressing disappointment. Early in their marriage, both of them worked demanding jobs, and they often came home exhausted. Whenever she raised a concern, the conversation sometimes ended with her husband explaining why the circumstances could not be changed.
He was not always dismissive.
There were times when he listened carefully and adjusted his behavior.
But she began noticing that the conversations she avoided produced less immediate tension.
Over time, silence became her preferred response.
She stopped asking for help with responsibilities she found overwhelming.
She stopped explaining when certain comments hurt her.
And eventually, she began convincing herself that having needs was a form of selfishness.
There is a difference between being considerate and denying our own humanity.
A healthy marriage requires both people to recognize the needs and responsibilities of the other.
There may be seasons when one spouse carries more because the other is dealing with illness, unemployment, grief, or extraordinary work demands.
Love involves sacrifice.
But sacrifice should not become a permanent expectation that one person's concerns never matter.
When someone becomes afraid to communicate ordinary needs, the relationship may develop an appearance of harmony that conceals considerable loneliness.
The solution is not always a single emotional conversation.
Longstanding patterns can require time to understand and change.
Some couples benefit from counseling that helps them communicate more effectively.
Where manipulation, intimidation, or abuse is present, the person affected may need individual support and safety planning rather than being encouraged toward greater vulnerability with someone who may use that openness against them.
But in a relationship where both people are willing to act respectfully, honesty can create opportunities for greater understanding.
The woman does not need to accuse her husband of intentionally creating every problem.
She can begin by acknowledging what she has been experiencing.
She might explain that she often agrees to things because she fears conflict and that she wants to become more honest about her needs.
Her husband may be surprised.
He may feel hurt that he did not recognize the problem sooner.
They may need to discuss decisions made over many years.
But the conversation gives them an opportunity to understand one another more accurately.
The alternative is continuing a pattern in which both people believe the relationship is functioning well for entirely different reasons.
One sees peace.
The other experiences silence.
And neither fully understands the distance between them.
When Jesus Does Not Need You to Make Yourself Look Better
There is a reason people sometimes become uncomfortable when Christian teaching begins addressing personal sin.
We know how to talk about problems that have happened to us.
We may be far less comfortable discussing problems we have created.
It is easier to explain how someone mistreated us than to acknowledge a situation in which we acted selfishly.
We can identify circumstances that made dishonesty tempting without wanting to admit that we were dishonest.
We may recognize that someone else behaved cruelly while refusing to consider whether our response also caused harm.
Again, these distinctions matter.
A person who has been abused is not responsible for the abuse.
Someone who experienced betrayal should not be pressured into accepting blame for another person's choices.
But even people who have suffered unfairly may encounter situations where they need to examine their own conduct separately from the wrong done to them.
Christian repentance calls us toward truthful responsibility, not indiscriminate self-blame.
The saving grace of Jesus Christ makes that examination possible without requiring us to construct a flawless history.
Romans 5:8 says, “But God commendeth his love toward us, in that, while we were yet sinners, Christ died for us.”
Those words reveal that Christ's saving work was not initiated because humanity had already become morally impressive.
He came for sinners.
That is why we do not have to pretend that sin is less serious than Scripture teaches.
We can acknowledge our need for forgiveness because the Gospel provides a Savior.
But the same truth means we should not use grace as permission to remain dishonest about the way we live.
Zacchaeus's response demonstrates that repentance can reach into the practical circumstances of a person's life.
He did not merely express pleasure that Jesus had come to his house.
He declared his intention to give half his goods to the poor and restore fourfold whatever he had wrongfully taken through false accusation.
That commitment mattered because it acknowledged financial responsibility toward other people.
It was not simply an attempt to improve his feelings about himself.
The people who may have been harmed by wrongful financial conduct mattered.
The poor mattered.
And the resources he possessed became part of his response to Jesus.
We should not interpret those actions as a way to purchase salvation.
Jesus was the Savior, and His declaration in Luke 19:9 identified salvation as the central significance of the encounter.
But Zacchaeus's commitments demonstrated that receiving the Savior was not disconnected from the responsibilities of ordinary life.
Grace and truth belonged together.
The Fear That Someone Will Stop Loving You If You Change
A man begins attending counseling after recognizing that his habit of making jokes at other people's expense has damaged several friendships. He has always considered himself funny, and people often laugh when he makes sharp comments about coworkers or family members.
But he has begun noticing that some people become quiet around him.
Others avoid discussing personal concerns because they fear becoming the subject of his humor.
He realizes that something he has treated as part of his personality may be causing unnecessary hurt.
He begins practicing a different way of communicating.
At first, the change feels awkward.
He worries that people will find him boring.
He is afraid that if he stops being the person who makes everyone laugh, his friends will no longer find him interesting.
That fear reveals how closely identity can become connected to behavior.
We may know that a habit needs to change while still fearing that changing it will cost us the relationships built around it.
Someone who has always been the person willing to drink excessively may worry about losing friendships when they stop.
A person who participates in cruel gossip may fear being excluded from the group if they refuse.
Someone who has become the dependable rescuer may worry that establishing boundaries will leave them unwanted.
These concerns can be emotionally powerful.
They may even involve real losses.
Some relationships are built around patterns that cannot continue if a person begins living differently.
But preserving those relationships at the cost of ongoing wrongdoing is not necessarily a loving or faithful decision.
We need to consider what makes a relationship healthy.
Does it allow room for honesty?
Can someone establish a reasonable boundary without being punished?
Are people willing to recognize growth?
Does the relationship encourage conduct that reflects compassion and integrity?
Not every friendship will meet every ideal.
Human beings are imperfect, and relationships require patience.
But if someone only values us when we participate in behavior we now recognize as wrong, we may need to reconsider the authority that relationship holds over our decisions.
Following Jesus can involve changes that other people do not understand.
That does not give Christians permission to become self-righteous or contemptuous.
We are still called to humility and love.
But we cannot make the approval of every person around us the final measure of what is right.
Galatians 1:10 challenges the desire to please people when doing so conflicts with serving Christ.
That is an important reminder for anyone whose identity has become dependent upon remaining acceptable to a particular group.
There is a difference between loving people and surrendering our moral judgment to their approval.
The Relief of Discovering That Honesty Is Not the End of Love
The woman eventually tells her husband that she has been struggling with the way they communicate. They are sitting together after dinner, and she begins cautiously because she does not know how he will respond.
She explains that she often agrees with decisions before considering what she actually thinks.
She tells him that she sometimes feels lonely even when they are spending time together because she has become afraid to discuss anything that might lead to disagreement.
Her husband listens quietly.
At first, he feels defensive.
He remembers many occasions when he asked for her opinion and believed she agreed willingly.
He is surprised to learn that some of those answers did not reflect what she wanted.
But as they continue talking, he begins recognizing that his own responses may have contributed to the pattern.
He sometimes treated disagreement as a problem to resolve quickly rather than an opportunity to understand her perspective.
And she recognizes that avoiding honesty has prevented him from knowing what was happening.
Neither person can repair seventeen years of communication habits in one evening.
But they can begin approaching the relationship differently.
He can become more patient when she expresses concerns.
She can practice speaking honestly before resentment builds.
They may need help learning how to discuss disagreement without treating it as a threat.
The important change is that they are beginning to value genuine understanding above the appearance of constant agreement.
This example does not mean that every relationship will respond well to honesty.
Some people react with anger or manipulation when another person establishes reasonable boundaries.
In those situations, safety and appropriate support matter.
But where mutual care exists, greater truthfulness can make love more meaningful because the people involved are no longer depending entirely upon an incomplete image of one another.
I think there is something spiritually important about that distinction.
God's love is not based upon an inaccurate understanding of who we are.
Jesus Christ knows human sin.
He understands our need for grace.
His saving mission does not depend upon our ability to conceal the parts of our lives that need repentance.
And because He is the Savior, we can approach Him honestly rather than attempting to create a version of ourselves that appears worthy of His attention.
When You Stop Confusing Your Role With Your Worth
A retired teacher attends a school event where former students have gathered to celebrate an anniversary. Several recognize her immediately and share memories of the difference she made in their lives. She is grateful, and the conversations remind her that her years of teaching had meaning.
But she also notices that some of the students remember lessons she barely recalls.
Others mention moments when she was especially patient during difficult circumstances.
She begins understanding that the value of her work was not limited to official evaluations, awards, or professional recognition.
It was also present in relationships and ordinary acts of care that mattered to people long after she forgot them.
Retirement had been difficult because teaching occupied such an important place in her identity.
Without a classroom, she sometimes wondered whether she still had a purpose.
But the gathering reminds her that her life is larger than the position she once held.
She can appreciate the work she accomplished without needing to remain in that role forever.
This is a distinction many people eventually need to make.
We may be parents, employees, business owners, caregivers, pastors, teachers, or volunteers.
These roles can be meaningful and important.
But they are not the entire measure of our value before God.
A parent whose children become independent does not cease to possess worth.
Someone who loses employment is not suddenly less human.
A caregiver who needs assistance has not become a failure.
And a person who has made serious mistakes does not become incapable of repentance and spiritual growth.
The Gospel directs us toward an identity grounded more deeply than our changing circumstances.
Second Corinthians 5:17 speaks of the new creation in Christ.
The verse does not mean that our personalities, memories, or earthly responsibilities disappear.
It points toward the transforming reality of belonging to Jesus.
Our relationship with Him becomes foundational.
That should influence how we understand success, failure, responsibility, and hope.
We can value the roles we occupy without making them our savior.
And when those roles change, we can continue seeking to live faithfully before God.
The Moment Zacchaeus Came Down
Luke 19:6 says that Zacchaeus “made haste, and came down, and received him joyfully.”
The account is brief, but the response is significant.
He did not remain in the tree.
He responded to Jesus' call.
And the encounter moved from the road into the setting of his home.
We should not claim to know every emotion Zacchaeus experienced, but the actions Scripture records reveal his willingness to receive Jesus.
That matters because we can sometimes become comfortable remaining at a distance from the very truth we claim to desire.
We want to understand Christ, but we hesitate when His teaching reaches something personal.
We want forgiveness, but we resist the possibility that repentance will require restitution.
We want peace, but we continue protecting a false appearance that prevents honest relationships.
We admire love, but we are afraid that becoming more truthful will disappoint people who have benefited from our silence.
These tensions do not disappear merely because we recognize them.
Some habits develop over many years.
Changing them may require practice, support, and repeated effort.
But there is an important difference between recognizing a difficulty and deciding that it must remain unchanged.
Christian growth calls us toward the second possibility.
We can become more honest.
We can learn to communicate with humility.
We can address wrongdoing rather than spending our lives defending it.
And we can recognize that our worth before God rests upon His saving grace rather than the image we have managed to present.
The woman whose marriage appeared easy may need months or years to develop healthier communication.
The man who agrees to every request may need to practice reasonable boundaries.
Someone who has hidden serious wrongdoing may face difficult consequences when the truth becomes known.
We should not promise that every outcome will be comfortable.
But living with greater truthfulness allows us to respond to real circumstances rather than continuing to manage an illusion.
Being Loved Without Having to Disappear
The woman and her husband begin having small conversations that once would have been avoided. Sometimes they disagree. Occasionally, one of them becomes defensive and needs time before returning to the discussion.
Their marriage has not suddenly become effortless.
In some ways, it feels more complicated because they are finally acknowledging differences that remained unspoken for years.
But there is also a growing sense of closeness.
Her husband is learning about concerns he previously did not understand.
She is discovering that expressing a need does not automatically result in rejection.
And both are beginning to recognize that genuine love requires more than the absence of disagreement.
It requires a willingness to know and respond to another person honestly.
That is an important human lesson, but the Gospel leads us toward something even greater.
Jesus Christ came to seek and save the lost.
He did not come because sinners had successfully concealed their wrongdoing.
He came because humanity needed salvation.
That truth offers extraordinary hope to those who have spent years believing they must become more impressive, more dependable, or more morally acceptable before approaching God.
We cannot earn His grace through presenting the right image.
We receive salvation through faith in Christ.
And because His grace calls us toward repentance, we can begin surrendering the habits and falsehoods that prevent us from living faithfully.
We do not have to become strangers to ourselves in order to receive human approval.
We do not have to pretend that our needs are nonexistent to demonstrate love.
And we do not have to conceal genuine sin from the Savior whose mission was to seek the lost.
There is a difference between being exposed by someone who wants to humiliate us and being known by Christ, who calls us to repentance and offers salvation.
The former may leave us frightened and defensive.
The latter invites us toward truth and grace.
But we must be willing to respond.
Zacchaeus came down from the tree.
He welcomed Jesus.
And the encounter would soon reach into the area of his life where wealth, responsibility, and the claims of other people mattered.
That is where the story becomes especially personal.
Because receiving the love of Jesus is not merely an opportunity to feel accepted.
It is the beginning of a relationship with the Savior whose grace is great enough to forgive sin and whose truth is important enough to change how we live.
Perhaps the question worth carrying into our own lives is not whether we can persuade everyone that we are the person they want us to be.
Perhaps it is whether we are willing to stop hiding behind that person long enough to approach Jesus honestly.
To tell the truth about what we need.
To acknowledge what we have done.
To accept responsibility where it belongs.
And to discover that the Savior does not require a carefully maintained appearance of perfection before He calls us to Himself.
Sometimes the first step toward a more faithful life is no longer disappearing behind the role we have spent years performing.
Sometimes it is allowing the truth to become visible.
And trusting that Jesus Christ, who came to seek and save the lost, is not turned away by the very need that brought Him into the world.
Chapter 3: The Apology You Keep Postponing Because You Know It Will Change Something
The woman had written the message six times and deleted it six times. Her younger sister lived less than an hour away, but they had barely spoken in eighteen months. The distance between them began with a disagreement over their mother's care, although neither woman would have described the situation that simply. There had been years of frustration before the argument, years of believing the other person did not understand how much responsibility she was carrying. When their mother became ill, those frustrations emerged in conversations about appointments, expenses, and who should make important decisions. Eventually, the older sister said something cruel during a telephone call, something she knew would hurt because it touched an insecurity her younger sister had carried since childhood. She regretted the words almost immediately. But instead of apologizing, she reminded herself of everything that had led to the argument. Her sister had been difficult. The responsibilities had been unfairly divided. She had been exhausted. Every explanation contained enough truth to make the apology feel less urgent.
Now, sitting at her kitchen table, she could no longer pretend that the silence was entirely her sister's responsibility. She knew she had said something deliberately hurtful. She could remember the exact moment when she stopped trying to explain her frustration and began trying to make her sister feel it. That was the part she could not defend, no matter how many times she revisited the circumstances. She had wanted her sister to understand how overwhelmed she felt, but instead of speaking honestly about her needs, she had used a painful memory as a weapon. Eighteen months later, she was still waiting for a way to apologize that would not require admitting how wrong that decision had been.
I think many of us know what it feels like to carry a conversation that has never happened. We remember what we should have said, imagine how the other person might respond, and gradually become convinced that waiting is the most responsible choice. Sometimes waiting genuinely is appropriate. A person may have requested distance, or direct contact may be unsafe. There are situations involving abuse, legal concerns, or serious violations of trust where professional guidance is necessary before making contact. But there are also times when we postpone a difficult conversation because we know that honesty will cost us something. It may cost us the comfort of believing we were entirely innocent. It may require us to acknowledge a responsibility we have avoided. And perhaps most frightening of all, it may reveal that another person is not ready to give us the forgiveness we want.
That is where repentance becomes something more demanding than regret.
Regret can remain private. We can feel sorry for years without anyone knowing. We can replay an event, criticize ourselves, and promise that we will never behave that way again. But when wrongdoing has affected another person, repentance may require a response that reaches beyond our private emotions. It may involve correcting something we said, returning something we took, or acknowledging harm without demanding that the person who experienced it make us feel better.
This is one of the reasons I find the later part of Zacchaeus's encounter with Jesus so important.
Luke 19:8 records him saying, “Behold, Lord, the half of my goods I give to the poor; and if I have taken any thing from any man by false accusation, I restore him fourfold.”
I want to pay attention to the responsibility contained in that statement rather than treat it simply as evidence that Zacchaeus had become generous. Generosity certainly matters. Giving half his goods to the poor represented a substantial commitment. But his promise of restitution concerns something different. It acknowledges that there may be people whose resources were wrongfully taken and that those people deserve more than his private regret.
The Bible does not tell us which individuals may have received repayment. It does not describe their financial circumstances or the conversations that might have followed. We should not create those details and present them as biblical history. But Scripture clearly records Zacchaeus's willingness to restore fourfold whatever he had taken through false accusation.
That commitment matters because it recognizes a truth we often resist.
The person who wants forgiveness is not the only person whose experience matters.
The Hardest Part of Saying You Were Wrong
A father arrives early for his adult son's birthday dinner. He has brought a gift and hopes they will enjoy a quiet evening together. Their relationship has improved during the past year, but certain subjects remain difficult. The son has occasionally mentioned how frightened he felt when his father became angry during childhood. Each time, the father has responded by explaining that he was under pressure and believed strict discipline was necessary.
Now, while helping prepare dinner, the son mentions an incident they both remember.
He describes being fourteen years old and making a mistake with a household chore. His father became furious, shouted at him in front of relatives, and continued criticizing him long after the mistake had been corrected.
The father remembers the incident.
He also remembers the financial stress, the exhaustion, and the sense that every responsibility rested upon him.
Those memories are real.
But as his son speaks, he begins noticing something he has avoided for years. His explanations have always centered on why he was angry. They have rarely addressed what it was like for his child to be frightened by him.
For a moment, he wants to defend himself again.
He wants to remind his son that he worked hard and never abandoned the family.
But those facts do not change the way he behaved that afternoon.
He begins to understand that acknowledging the harm does not require denying every good thing he did as a father. He can recognize that he provided for his family and still admit that he sometimes expressed anger in destructive ways.
Those truths can exist together.
This is an important distinction because many people resist repentance out of fear that admitting a mistake will erase everything good about them. We think that if we acknowledge cruelty, people will decide we are cruel in every circumstance. If we admit dishonesty, we fear nobody will recognize the times we told the truth. If we acknowledge selfishness, we worry that every sacrifice we made will suddenly become meaningless.
But honest responsibility does not require pretending that human beings are simple.
We can love someone and still hurt them.
We can make meaningful sacrifices while also making serious mistakes.
And we can recognize that our intentions were not entirely bad without using those intentions to excuse conduct that was wrong.
The father does not need to decide that his entire life was a failure before apologizing to his son. He needs to acknowledge the particular behavior that caused harm.
That is more honest than either extreme.
It avoids turning repentance into self-destruction while refusing to turn our positive qualities into excuses.
Sometimes the hardest part of an apology is accepting that we cannot control what the other person will think after hearing it.
They may appreciate our honesty.
They may need time.
They may be angry that it took so long.
And they may remember additional experiences we are not prepared to discuss.
An apology does not give us control over those reactions.
It simply creates an opportunity to take responsibility.
The Apology That Secretly Asks to Be Forgiven Immediately
A man sits across from his wife after acknowledging that he concealed several financial decisions. He has apologized repeatedly and begun working with her to understand the full extent of their debt. He has also become frustrated because she continues asking questions about transactions he thought they had already discussed.
He tells her that he cannot change the past and wants them to move forward.
He means it sincerely.
He is ashamed of what happened and wants their marriage to recover.
But his wife is still trying to understand the financial circumstances that now affect their household. Some information is new to her. She is worried about their obligations, and the fact that he concealed the problem has made it difficult for her to trust his explanations.
He has been living with the truth for a long time.
She has only recently begun discovering it.
Their experiences are not moving at the same speed.
This is where an apology can quietly become another demand.
We may tell someone we are sorry while expecting immediate reassurance. We want them to say that everything is forgiven, that the relationship will recover, and that we no longer need to discuss what happened.
When those words do not come, we begin feeling rejected.
Sometimes we accuse the other person of being unwilling to let go of the past.
But we may be asking them to recover from a harm according to the timetable that is most comfortable for us.
That is not the same thing as taking responsibility.
The person who caused harm may have legitimate needs for emotional support, counseling, and spiritual guidance. Guilt can be painful, and nobody benefits from remaining trapped in hopeless self-condemnation. But those needs should not automatically become the responsibility of the injured person.
A spouse who has been deceived is not obligated to make the person responsible feel better about the deception.
An adult child who remembers frightening behavior is not required to reassure a parent that everything was acceptable.
And someone who experienced abuse should never be pressured into contact or reconciliation because the person who harmed them now claims to have repented.
Forgiveness and reconciliation are related, but they are not identical.
Reconciliation requires appropriate safety, honesty, and the willing participation of those involved. Trust may need to be rebuilt through consistent behavior, and in some situations restoring the relationship will not be safe or appropriate.
Christian repentance should respect those realities.
When Zacchaeus declared that he would restore fourfold whatever he had wrongfully taken, the statement concerned responsibilities that could be addressed through action. It did not require the people affected to provide him with immediate emotional approval.
His willingness to make restitution was meaningful regardless of whether others praised him for it.
That is something worth remembering when we apologize.
We should be willing to do what is right even when the response is not what we hoped to receive.
The Money You Owe Is Not Just a Number
A man opens a message from a former friend who helped him during a period of unemployment. The friend had lent him money to cover several months of essential expenses. At the time, they agreed that repayment could begin once he had stable employment.
He eventually found work and began earning enough to cover his household needs.
But the debt became something he avoided discussing.
He had grown accustomed to managing his finances without including repayment in his plans. There were other expenses, and he told himself that his friend was financially comfortable enough not to need the money urgently.
Now the friend explains that circumstances have changed and asks when repayment can begin.
The man feels embarrassed and irritated.
Part of him believes the message is unfair because he has been under pressure.
Another part recognizes that his friend's financial position was never the measure of whether the obligation mattered.
The money was borrowed.
He promised to return it.
And the promise remains important.
There may be legitimate complications. His current income may not allow immediate repayment. They may need to establish a realistic arrangement or seek appropriate guidance if the situation has become legally or financially complex.
But the discomfort of the conversation does not eliminate the obligation.
Sometimes we become so focused upon how a responsibility affects us that we forget it also affects another person.
The friend may have postponed purchases or relied upon savings because the money was never returned.
Perhaps the delay damaged trust more than the original financial loss.
The borrower cannot determine those consequences solely by imagining how he would feel in the friend's position.
He needs to listen.
And he needs to respond honestly.
This is why restitution is different from simply feeling remorse.
Remorse recognizes that something went wrong.
Restitution seeks to address an actual loss when doing so is appropriate and possible.
The Bible includes principles concerning repayment for wrongful gain. Leviticus 6:4–5 addresses restoration of property obtained through specified wrongdoing. Numbers 5:6–7 also connects confession with restitution in particular cases.
The details of these laws vary, and we should not treat every biblical repayment requirement as though it applies identically to every modern situation.
But the underlying concern is clear.
The rights of the person who suffered the loss matter.
That is why Zacchaeus's promise is so significant. He does not speak only about his own spiritual experience. He acknowledges obligations that could require him to surrender resources for the sake of justice.
There is something deeply personal about that kind of repentance.
It requires us to recognize another person's need even when acknowledging it places demands upon us.
When You Cannot Give Back What You Took
The older woman sat beside a box of photographs her daughter had brought from storage. They were sorting through family memories when they found pictures from a school performance almost thirty years earlier. Her daughter smiled at the costumes and pointed out several classmates, but then she mentioned that her mother had not attended the event.
The mother remembered.
She had been working overtime and believed she could not afford to miss the shift.
The financial pressure was real.
But there had also been other occasions when she chose work over family activities even when the choice was less necessary.
As they looked through the photographs, she felt a familiar wave of regret.
She wanted to explain every circumstance.
She wanted her daughter to understand how hard those years had been.
But her daughter was not accusing her of having no love.
She was remembering something that mattered.
The mother could not return to that evening.
She could not sit in the audience or applaud at the end of the performance.
No amount of regret could place her in the photograph.
Some kinds of harm cannot be repaired through repayment.
A missed childhood cannot be returned.
A broken confidence cannot always be restored.
Words spoken in cruelty may remain part of someone's memory long after the person who spoke them has changed.
And some opportunities for reconciliation end through death, distance, or another person's decision to maintain boundaries.
We need to be honest about those limitations.
Christian hope should not become a way of promising people that every earthly consequence will disappear if they repent sincerely enough.
Scripture does not make that promise.
But the inability to repair everything does not make repentance meaningless.
The mother can acknowledge her daughter's disappointment without turning the conversation into a defense of every decision she made.
She can express regret honestly.
She can become more present in the relationships available to her now.
And she can allow what she has learned to influence the commitments she makes in the years ahead.
Those actions do not restore the lost evening.
But they can reflect a changed heart.
There is a difference between accepting that the past cannot be changed and using that reality to avoid changing the present.
The first is maturity.
The second can become another form of surrender to old habits.
Psalm 51 offers a powerful picture of repentance. David acknowledges his sin and asks God for mercy and a clean heart. The psalm does not suggest that sincere repentance makes wrongdoing unimportant. It recognizes both the seriousness of sin and the need for God's restoring grace.
We can approach Christ with that same honesty.
We cannot undo every consequence.
But we can confess our sin, pursue appropriate responsibility, and allow God's truth to shape the way we live.
The Strange Way Pride Can Sound Like Humility
A woman discovers that she made an error while preparing an important report for her organization. The mistake affected several decisions, and her supervisor asks her to review the information and explain what happened.
She is devastated.
She begins telling coworkers that she is terrible at her job, that she never does anything correctly, and that the organization would probably be better without her.
Several people reassure her.
They remind her of her experience and the many things she has done well.
For a little while, their encouragement helps.
But the practical issue remains unresolved.
The report still needs correction.
The affected decisions still need review.
And the people relying upon the information need an accurate explanation.
Sometimes our response to wrongdoing becomes so focused upon how badly we feel about ourselves that we avoid the responsibility actually required.
We may believe that harsh self-criticism demonstrates humility.
But declaring ourselves worthless does not necessarily help the people affected by our mistake.
It may even place them in the position of comforting us when they need us to address the problem.
Humility is not the belief that we possess no value.
It is the willingness to see ourselves truthfully.
That includes recognizing strengths without arrogance and acknowledging failures without endless self-condemnation.
The employee can admit that she made an error.
She can take responsibility for correcting the report.
She can seek assistance if the problem requires expertise beyond her own.
And she can learn from what happened without deciding that every contribution she has made was meaningless.
That is a more useful response than either denial or personal destruction.
The same principle applies to spiritual repentance.
We do not honor God by insisting that our sin was harmless.
But neither do we need to spend the rest of our lives declaring that His grace could never be sufficient for us.
First John 1:9 says, “If we confess our sins, he is faithful and just to forgive us our sins, and to cleanse us from all unrighteousness.”
That promise is grounded in God's faithfulness.
It does not make restitution or appropriate accountability unnecessary.
But it reminds us that forgiveness is not something we earn through an endless performance of shame.
We come to Jesus because we need a Savior.
And because He is the Savior, our failures do not have to become the final authority over our identity.
The Conversation That Does Not End the Way You Hoped
The woman who had been writing to her sister eventually sends a short message asking whether her sister would be willing to talk. She does not begin by explaining every frustration that led to their argument. She simply acknowledges that she said something deliberately hurtful and that she has wanted to apologize.
Several days pass before she receives a response.
Her sister thanks her for reaching out but explains that she is not ready for a conversation.
The older sister feels disappointed.
She had imagined that admitting her mistake would open the door to reconciliation. She hoped her sister would say that she understood how stressful their mother's illness had been and that both of them had said things they regretted.
But that is not what happens.
Her sister needs more time.
And the older woman must decide whether she is willing to respect that response.
She could become angry and tell herself that apologizing was pointless.
She could send additional messages insisting that her sister has an obligation to forgive.
Or she could recognize that taking responsibility was the right thing to do even though it did not produce the outcome she wanted.
That final choice may be the most meaningful.
It requires her to stop treating reconciliation as something she can obtain through a sufficiently convincing apology.
She can acknowledge her wrongdoing without controlling her sister's response.
She can continue learning to communicate without cruelty.
And she can respect the distance her sister has requested.
That respect may itself become part of her repentance.
We sometimes imagine that the best evidence of change is an emotional conversation in which everyone embraces and agrees to begin again.
Those moments can happen, and they can be beautiful.
But they are not guaranteed.
Sometimes the evidence of change is quieter.
We stop sending messages after someone asks for space.
We begin paying a debt without expecting praise.
We correct a false statement even though doing so embarrasses us.
We acknowledge responsibility without insisting that everyone recognize how difficult the acknowledgment was.
These choices reveal a willingness to place what is right above the immediate relief of feeling forgiven.
And that is a substantial change for someone who has spent years protecting themselves from discomfort.
The Grace That Makes Honest Repentance Possible
I do not want to leave this chapter with the impression that salvation depends upon successfully correcting every mistake we have made. That would place an impossible burden upon people and misunderstand the heart of the Gospel.
There are wrongs we cannot fully repair.
There are people we can no longer contact.
There are consequences that continue despite sincere repentance.
And there are situations where a person has done everything responsibly available to them while still feeling painful regret.
Jesus Christ did not come merely to offer a system through which people could earn forgiveness by completing enough corrective actions.
He came to seek and save the lost.
His death and resurrection are the foundation of Christian salvation.
Ephesians 2:8–9 teaches that salvation is by grace through faith and not through works.
That truth must remain central.
We do not give generously enough to purchase God's mercy.
We do not repay debts until our moral record becomes perfect.
And we do not reconcile every relationship before Christ becomes willing to save us.
We come to Him as sinners who need grace.
But genuine faith does not make us indifferent toward the harm we have caused.
If we can repay what we owe, we should take that responsibility seriously.
If we have lied, we should become committed to truth.
If we have treated someone cruelly, we should stop the behavior and respect the needs of those affected.
And if we have spent years avoiding accountability, repentance should challenge that avoidance.
This is not a contradiction.
Grace is the foundation of salvation.
Changed conduct is a fitting response to that grace.
Zacchaeus's declaration gives us a powerful picture of what that response can look like.
He was introduced as a wealthy chief tax collector.
After receiving Jesus, he spoke about giving generously and making restitution.
Jesus then announced that salvation had come to his house.
The story does not establish a universal financial formula for salvation.
It reveals the saving mission of Christ and the meaningful response of a man who encountered Him.
What It Means to Stop Protecting the Mistake
The woman who owes money to her friend finally makes the telephone call. She has prepared a realistic repayment plan and gathered information about her finances so that she can speak honestly rather than make another vague promise.
Her friend listens.
There is disappointment in the conversation.
The delay caused frustration, and the friendship has been affected.
But the woman no longer attempts to explain the problem entirely through difficult circumstances.
She acknowledges the obligation and the decisions that contributed to the delay.
Then she asks whether the proposed arrangement would be acceptable.
They discuss what can realistically happen next.
The conversation does not erase the past.
It may take months to complete repayment, and the friendship may need longer to recover.
But the woman is no longer pretending the debt belongs outside her responsibilities.
She has stopped protecting the mistake.
There is something deeply freeing about that change, even when the consequences remain difficult.
We no longer have to remember which explanation we offered to which person.
We do not have to spend every conversation defending our innocence.
We can recognize that we made a wrong decision and begin concentrating upon what faithfulness requires now.
That does not mean our lives become simple.
Some people will remain disappointed.
Certain relationships may never recover.
Financial consequences can be serious, and truthful responsibility may create painful obligations.
But a life built around honesty offers something that endless self-defense cannot.
It allows us to deal with reality.
And it allows us to approach Jesus without pretending that our moral record has always been clean.
The Apology That Finally Becomes About Love
Months later, the older sister receives a brief message from her younger sister. Their mother has an appointment coming up, and the younger woman asks whether they can discuss some practical details.
It is not the reconciliation the older sister once imagined.
There is no declaration that everything has been forgiven.
They speak about transportation, scheduling, and what their mother may need afterward.
The conversation is polite but cautious.
The older sister notices the impulse to bring up her apology again.
She wants to know whether her sister has reconsidered.
She wants reassurance that their relationship will eventually return to what it once was.
But she recognizes that the immediate purpose of the conversation is their mother's care.
Her sister has offered an opportunity to coordinate responsibilities, not a promise of emotional reconciliation.
So she listens.
She discusses what she can realistically do.
She avoids the criticism and defensiveness that once shaped their conversations.
And when the call ends, she allows it to end without demanding anything more.
For the first time, she understands that becoming a better sister may involve respecting the relationship as it actually exists rather than insisting upon the relationship she wishes they had.
That does not mean she stops hoping for reconciliation.
It means she stops making her hope an obligation her sister must fulfill.
She can love without controlling the response.
She can take responsibility without requiring praise.
And she can continue growing even when another person is not ready to trust her.
I think that is one of the most difficult and beautiful changes repentance can produce.
We become less occupied with proving that we are good people and more committed to doing what is good.
The difference may sound small.
In actual relationships, it can change everything.
What Jesus Sees When We Finally Tell the Truth
The encounter with Zacchaeus began with a man who wanted to see Jesus.
He climbed a tree because the crowd prevented him from seeing clearly.
Jesus stopped, called him by name, and entered his home.
The crowd objected because Zacchaeus was regarded as a sinner.
Then the man's response reached directly into his financial responsibilities.
He spoke about giving to the poor and restoring what had been wrongfully taken.
And Jesus declared that salvation had come.
The significance of that sequence is not that Zacchaeus became impressive enough to deserve salvation through a substantial financial commitment.
It is that the Savior came to seek the lost, and the encounter produced repentance that had practical meaning.
That truth reaches into the private places where many of us have been avoiding responsibility.
Perhaps you have an apology you keep postponing.
Maybe there is money you need to repay, a false statement you should correct, or a relationship in which you have spent years defending behavior you now recognize was harmful.
You may be frightened by what honesty will require.
The consequences may be real.
The other person may not respond the way you hope.
But avoiding the truth cannot create the kind of peace that comes from faithfully addressing what is right.
And you do not have to purchase the grace of Jesus Christ before you begin.
You can approach Him honestly.
You can confess your sin and trust in His saving work.
Then you can consider what responsible action is possible in the circumstances of your life.
Sometimes that action will involve a difficult conversation.
Sometimes it will require restitution.
At other times, it may involve respecting someone's boundaries and changing your conduct without expecting any opportunity to demonstrate the change directly.
What matters is the willingness to stop making your emotional comfort the center of repentance.
The people affected by our choices matter.
Their needs matter.
And the truth matters.
The woman who waited eighteen months to acknowledge the words she spoke to her sister cannot undo that afternoon. She may never receive the reconciliation she wants. But she can stop defending the cruelty she once justified. She can become more patient, more honest, and more respectful of the people around her.
The man who owes his friend money cannot recover the trust that was lost simply by feeling sorry. But he can begin fulfilling the obligation.
And the father who frightened his son cannot return to that childhood argument. But he can become someone who listens before defending himself.
None of these changes is a substitute for salvation.
Jesus Christ alone saves.
But they can become expressions of a life increasingly shaped by His grace.
There is a profound difference between being forgiven and refusing to face what happened.
The grace of Christ does not require the second in order to offer the first.
Instead, His grace gives us reason to come into the truth.
To stop constructing explanations for what we know was wrong.
To take responsibility without declaring ourselves beyond redemption.
And to recognize that repentance becomes more meaningful when it begins considering the people who have been carrying the consequences of our decisions.
Zacchaeus stood before Jesus and spoke about what he would give and what he would restore.
The promise was costly.
It was personal.
And it reached beyond the way he wanted to feel about himself.
Perhaps the apology we have been avoiding is difficult for the same reason.
It asks us to surrender the comfort of our own explanation and recognize another person's pain.
But sometimes that is where a new kind of honesty begins.
And sometimes the most faithful thing we can do is stop waiting for a way to tell the truth that costs us nothing.
Chapter 4: The Person You're Becoming May Be Someone You Don't Know How to Be Yet
The man had been retired for seven months when his wife finally asked him why he seemed angry all the time. They were sitting at the kitchen table after breakfast, and she had asked a simple question about their plans for the afternoon. He responded sharply, telling her that he did not need someone organizing every minute of his day. She looked at him for a moment and explained that she was not trying to control him. She wanted to know whether he would be home because she had an appointment and needed to arrange transportation. He apologized for his tone, but the conversation stayed with him long after she left. He had spent thirty-eight years getting up before sunrise, managing difficult projects, solving problems, and making decisions that affected dozens of people. Now he woke up most mornings without anyone needing his direction, and he was beginning to realize that the loss of his professional responsibilities had affected him more deeply than he wanted to admit.
His wife had encouraged him to enjoy retirement. His children were pleased that he finally had time to rest. Friends suggested hobbies, volunteer work, and opportunities to travel. He appreciated their concern, but their suggestions often irritated him because they seemed to assume that finding something to do would solve the problem. What he missed was not simply having a busy schedule. He missed knowing exactly who he was when he entered a room. At work, people knew his position, respected his experience, and expected him to provide answers. He understood the responsibilities and felt comfortable with the authority that came with them. Now he was discovering how much of his identity had become attached to being the person in charge. Without that familiar role, he felt uncertain, and uncertainty was an emotion he had spent most of his adult life trying to avoid.
I think change can be especially difficult when the person we are becoming does not yet feel familiar. We may recognize that an old habit was unhealthy, that a relationship needs different boundaries, or that our understanding of success has become too narrow. We may even feel relieved to acknowledge those things. But afterward, ordinary life continues, and we must begin making decisions without relying upon patterns that once made us feel secure. A person who has spent years avoiding conflict may not know how to express disagreement kindly. Someone who has used anger to maintain control may feel powerless when learning to respond with patience. A person whose identity has been built around wealth or achievement may struggle to understand what makes life meaningful when those accomplishments no longer occupy the center.
This is another important dimension of repentance. We often speak about turning away from wrongdoing as though the only challenge is deciding to stop. Sometimes the decision is clear, but the process of learning to live differently takes considerable time. Old behavior may have shaped our routines, relationships, expectations, and understanding of ourselves. When we begin changing those patterns, we may discover that we do not yet possess the habits needed to replace them. That uncertainty can make us want to return to what is familiar, even when we know the familiar pattern was causing harm.
The encounter between Jesus and Zacchaeus helps us consider this tension without pretending that Scripture provides details it does not record.
Luke tells us that Zacchaeus was a wealthy chief tax collector. He wanted to see Jesus, climbed a sycomore tree, received Him joyfully, and later declared his willingness to give half his goods to the poor and restore fourfold whatever he had taken through false accusation. Jesus announced that salvation had come to his house and explained that He came to seek and save the lost.
The passage does not tell us what Zacchaeus's daily life looked like afterward. We do not know whether he continued his occupation, how his financial circumstances developed, or what relationships changed because of his declaration. Those details should remain outside our claims about the biblical account.
But the response Scripture records allows us to ask a meaningful question about our own lives. What happens when our encounter with Jesus changes the priorities around which we have organized our existence? If something that once seemed essential becomes less important, how do we learn to live with that new understanding? And how do we remain faithful when the responsibilities ahead are less familiar than the habits we are leaving behind?
When You No Longer Know How to Be the Person Everyone Expects
A woman had spent most of her marriage making herself available whenever someone in the family needed assistance. She kept track of birthdays, remembered appointments, organized gatherings, cared for aging relatives, and handled the details that allowed everyone else's schedules to function. She genuinely loved her family, and many of those responsibilities brought her satisfaction. But over time, she became so accustomed to being available that her own needs rarely entered the conversation.
When her children became adults, they continued calling whenever something needed to be arranged. Her husband assumed she would manage family commitments because she always had. Relatives contacted her first when someone needed transportation or help with paperwork. She seldom refused because she had come to associate usefulness with love.
Then she developed a health problem that required treatment and more consistent rest.
For the first time in years, she began telling people she could not help with certain responsibilities. She asked her husband to manage several household appointments and encouraged her adult children to make arrangements without depending upon her.
Most of the family responded with concern and understanding.
But she still felt guilty.
Even while following medical advice, she worried that someone might think she had become selfish. She imagined that disappointing her family meant she was failing in a role she had fulfilled for decades.
The discomfort revealed how deeply the habit had shaped her identity. She did not simply need a lighter schedule. She needed to reconsider the belief that her worth depended upon constant availability.
That kind of change can be surprisingly difficult.
We may understand intellectually that healthy boundaries are appropriate while still feeling anxious whenever we establish one. We can recognize that rest is necessary while interpreting every quiet hour as wasted time. We may know that love does not require meeting every request but continue feeling responsible whenever another person is disappointed.
Learning to live differently involves more than agreeing with a new idea. We have to practice it in circumstances where the old response would feel easier.
The woman may need to remind herself that her family members are capable of accepting responsibilities she previously carried. She may have to tolerate the discomfort of saying no without immediately offering an elaborate explanation. She may need support as she adjusts to a season of life where caring for her own health is an essential responsibility.
None of this makes her less loving.
She is learning that love and self-neglect are not the same thing.
There is a spiritual lesson here, even though her circumstances are not an example of repentance from some particular sin. Sometimes growth involves surrendering a false belief about what makes us valuable. We become willing to recognize that God did not create us merely to satisfy every expectation other people place upon us.
We can serve generously while acknowledging legitimate limitations.
We can love deeply without becoming the only person responsible for everyone else's needs.
And we can recognize that changing the way we fulfill a role does not necessarily mean abandoning the people who matter to us.
The Strange Discomfort of Becoming More Honest
A man begins working with a counselor after recognizing that he has developed a habit of agreeing with people to avoid disagreement. At work, he accepts deadlines he knows are unrealistic. At home, he tells his wife he is comfortable with plans he actually dislikes. Among friends, he remains silent when someone makes a comment he believes is unfair.
He considers himself easygoing.
Other people often describe him the same way.
But privately, he feels increasingly resentful.
He has become convinced that everyone expects too much from him, even though he rarely communicates what he can reasonably provide.
During counseling, he begins recognizing that his silence has sometimes created misunderstandings. People made decisions based upon his apparent agreement. They believed he was comfortable because he told them he was.
The problem is not entirely his responsibility. Some people in his life may have been dismissive or inconsiderate. But he also recognizes a pattern he needs to change.
He begins practicing honest responses to ordinary questions.
When his supervisor proposes a deadline that cannot reasonably be met, he explains the resources required and suggests alternatives. When his wife asks whether he wants to attend a social event, he tells her that he is tired and would prefer a quiet evening, while remaining willing to discuss what matters to her. When friends make assumptions about his availability, he considers his existing responsibilities before agreeing.
At first, these conversations feel unnatural.
He worries that he sounds difficult.
He finds himself rehearsing simple responses before delivering them.
Sometimes he becomes overly apologetic because he is uncomfortable expressing a preference without justifying it.
But gradually, he discovers that honesty does not automatically destroy relationships.
Some people appreciate knowing what he actually thinks.
Others need time to adjust because they were accustomed to his constant agreement.
And a few may become frustrated when the arrangements that once benefited them begin changing.
That variety of responses is part of reality.
Becoming healthier does not guarantee universal approval.
Sometimes the very people who benefited from an unhealthy pattern will be the least enthusiastic about its correction.
This is why growth requires a foundation stronger than the immediate reactions of others.
If our willingness to change depends entirely upon everyone welcoming the change, we may abandon it as soon as someone becomes uncomfortable.
Christian maturity calls us toward faithfulness rather than universal approval.
It asks us to consider what is truthful, loving, and responsible before God.
That does not make other people's perspectives irrelevant. We should remain willing to receive legitimate correction. But we cannot surrender every conviction simply because someone dislikes the consequences.
There is a difference between humility and the fear of disappointing people.
Learning that difference can change the way we live.
When You Miss the Habit You Know Was Hurting You
A man has been working to change the way he responds during disagreements with his wife. For many years, he used withdrawal as a form of control. Whenever a conversation became uncomfortable, he stopped speaking, sometimes for days. He told himself that he needed time to calm down, and there were occasions when that was true. But he also recognized that prolonged silence allowed him to avoid accountability and left his wife anxious about when normal communication would resume.
With professional guidance, he begins learning to distinguish a healthy pause from punitive withdrawal.
If he feels overwhelmed, he can explain that he needs a break and agree upon a reasonable time to return to the conversation. He can work on calming himself without leaving his wife uncertain about whether he intends to address the problem.
The new approach requires effort.
There are moments when he misses the old pattern because it allowed him to escape discomfort immediately.
He knew how to become silent.
He knew how to wait until the other person became tired of the conflict.
What he does not yet know is how to remain emotionally present while hearing something he does not want to hear.
That is a skill he must develop.
Sometimes we assume that once someone recognizes harmful behavior, abandoning it should feel naturally satisfying. But habits often provide some immediate benefit, even when their long-term consequences are destructive.
Anger can create a temporary feeling of power.
Avoidance can reduce anxiety for a few hours.
Dishonesty can postpone embarrassment.
Overspending can provide momentary comfort.
A person may recognize the harm of a behavior while still missing the immediate relief it once provided.
This does not make continuing the behavior acceptable. It helps explain why lasting change may require support, practice, and accountability rather than a single emotional promise.
Christian repentance includes turning away from sin, but spiritual growth also involves learning to respond differently when familiar temptations return.
James 1:19 instructs believers to be swift to hear, slow to speak, and slow to wrath. That instruction can become deeply practical for someone learning to handle conflict.
Listening does not mean agreeing with everything.
Slowness to anger does not require tolerating abuse.
But the verse encourages a thoughtful response rather than allowing immediate emotion to govern conduct.
The husband can learn to listen without using silence to punish.
He can acknowledge when he becomes overwhelmed while remaining responsible for returning to the conversation.
And if his behavior has caused serious harm, he can accept that his wife may need boundaries and time before trusting the change.
The purpose of repentance is not to receive instant recognition for becoming different.
It is to turn toward what is right.
That remains worthwhile even when the process feels unfamiliar.
The Life Zacchaeus Had to Reconsider
There is something significant about the way Zacchaeus's declaration concerned his possessions.
Luke introduces him as rich, and later the man speaks about giving half his goods to the poor and restoring fourfold anything taken through false accusation.
The financial commitment was substantial.
But we should not treat the specific amount as a universal requirement for every Christian.
Scripture does not teach that salvation can be purchased through donating a particular percentage of one's possessions. Ephesians 2:8–9 makes clear that salvation comes by grace through faith rather than works.
Zacchaeus's response was meaningful because it reflected repentance in the circumstances of his life.
His wealth was part of those circumstances.
He was willing to address generosity and restitution in a way that carried personal cost.
That raises a deeper question about the things we have become accustomed to protecting.
What happens when following Christ begins changing our relationship with something we once considered essential?
A person who has relied upon professional status may need to become less concerned with appearing superior.
Someone who has used money to create a sense of control may need to become more generous and more honest about financial responsibilities.
A person whose identity depends upon being admired may need to make choices that others do not understand.
These changes can affect how we experience everyday life.
We may no longer receive the same emotional satisfaction from possessions that once seemed important.
We may find ourselves less willing to participate in conversations built around criticizing other people.
We may become uncomfortable with professional practices we previously accepted because they benefited us.
Sometimes the change reveals that we need to reconsider more than a single habit.
We need to reconsider the values around which we have organized our lives.
That is not always a comfortable process.
But comfort is not the final measure of faithfulness.
There may be times when becoming more consistent with the character of Christ requires us to surrender familiar advantages.
And the fact that something has been part of our identity for decades does not automatically make it worthy of remaining there.
The Unexpected Grief of Leaving an Old Identity Behind
A woman has spent years being the person everyone calls when there is a crisis. She is practical, decisive, and capable of managing difficult situations. Her family admires her strength, and she appreciates being trusted.
But she has also become accustomed to taking over when someone else is struggling.
She offers advice before listening.
She makes plans without always asking what the other person wants.
She becomes frustrated when people do not follow her suggestions, especially when she believes the solution is obvious.
Eventually, her adult daughter tells her that she sometimes feels unable to make decisions without being corrected.
The woman is hurt.
She believed she was helping.
And much of the time, she genuinely was.
But she begins recognizing that her desire to solve problems can prevent other people from developing confidence in their own judgment.
She decides to change how she responds.
Instead of immediately offering solutions, she asks whether someone wants advice or simply needs to talk. She learns to allow family members to make reasonable choices she would not have made herself.
Sometimes she watches them struggle with decisions she believes she could resolve quickly.
That is difficult.
She misses being the person who always knows what to do.
She misses the feeling of certainty that comes from taking control.
And she is surprised to discover a kind of grief beneath the change.
She is losing an identity that once made her feel valuable.
Not every part of that identity was unhealthy.
Her competence and willingness to help remain strengths.
But she needs to learn how to use those strengths without making other people dependent upon her authority.
This is an important part of personal and spiritual growth that we rarely discuss.
Sometimes becoming healthier means grieving the loss of a familiar role.
The person who stops dominating conversations may initially feel less interesting.
Someone who begins setting boundaries may fear becoming less useful.
A person who admits uncertainty after years of appearing confident may feel temporarily exposed.
These experiences do not necessarily mean the change is wrong.
They may reveal how much emotional security we placed in patterns we are now reconsidering.
We can acknowledge that difficulty without turning back.
We can appreciate what was good about an earlier season while recognizing what needs to change.
And we can begin learning a different way to express strengths that remain valuable.
For the woman accustomed to solving everyone's problems, becoming more patient does not mean losing her ability to help.
It means offering help in a way that respects the judgment and dignity of others.
That may require more humility than taking control ever did.
When You Begin Trusting God Without Needing to Predict Everything
The retired man who snapped at his wife eventually begins volunteering twice a week with an organization that helps adults improve their job skills. He initially considers the work a way to fill the empty hours in his schedule.
But he begins noticing that the people he meets do not need him to manage their lives.
They need someone who will listen, explain practical information, and encourage them while they make their own decisions.
He has years of professional experience that can be useful.
Yet some of his old habits do not fit the setting.
He cannot approach every conversation like a project meeting.
He cannot assume that someone who has been unemployed for months lacks discipline.
There may be health concerns, caregiving obligations, transportation problems, or other circumstances he does not understand.
He begins asking more questions before offering advice.
He discovers that the experience and knowledge he developed during his career still matter, but they can be used differently.
For the first time since retiring, he feels useful without needing to be in charge.
That change is meaningful.
He has not recovered his former professional identity.
He is beginning to discover that his life can contain value beyond it.
There are many circumstances in which we must learn to live without the certainty we once enjoyed.
A parent watches an adult child make independent decisions.
Someone leaves a long career and begins exploring unfamiliar responsibilities.
A person recovering from serious illness discovers that physical limitations require changes to plans that once seemed permanent.
A family experiences financial uncertainty and must reconsider what security means.
These situations differ, and we should not assume that every change is a direct spiritual lesson or the consequence of personal wrongdoing.
Some are simply part of living in a world where human circumstances are uncertain.
But faith can shape how we respond.
Proverbs 3:5–6 calls us to trust in the Lord rather than lean entirely upon our own understanding.
That trust does not remove the need for practical planning.
It does not guarantee that every decision will produce the outcome we prefer.
But it reminds us that our understanding is limited and that faithfulness does not require knowing everything that lies ahead.
Sometimes we must make responsible decisions while accepting uncertainty.
We can seek wise counsel.
We can use the resources available to us.
And we can pray for guidance without pretending that our plans have become infallible.
That is a different kind of strength from the ability to control every circumstance.
It requires humility.
And it can become especially important during seasons when familiar responsibilities or identities are changing.
The Person You Are Becoming Still Needs Grace
A woman who has spent years struggling with impatience notices that she handled a difficult conversation more calmly than she would have six months earlier. Her coworker misunderstood an assignment, and the mistake created additional work. In the past, she might have responded with immediate frustration and spent the rest of the afternoon complaining.
This time, she asks questions, helps correct the problem, and discusses how the instructions can be clearer in the future.
On the drive home, she feels encouraged.
The change did not happen automatically.
She has spent months recognizing her reactions, seeking guidance, and practicing more patient responses.
But several days later, another stressful situation occurs, and she speaks sharply to someone she loves.
She feels disappointed.
For a moment, she wonders whether the earlier progress was meaningless.
It was not.
One failure does not erase every responsible decision that preceded it.
But neither should she dismiss the harm of the sharp response merely because she has improved in other areas.
She can acknowledge what happened, apologize where appropriate, and consider what contributed to the reaction.
Then she can continue growing.
Christian maturity is not the achievement of a condition in which we never again need God's grace.
Our dependence upon Jesus Christ remains.
First John 1:9 reminds believers of God's faithfulness in forgiving and cleansing those who confess their sins.
The promise does not encourage indifference toward wrongdoing.
It calls us to honesty before God.
The same grace that provides the foundation for salvation continues reminding us that spiritual life is not sustained by the illusion of personal perfection.
We need Christ.
We need His truth.
We need the work of the Holy Spirit to shape our character.
And at times, we need the support of other people who can help us understand and address difficulties that we cannot resolve through determination alone.
That may include pastoral guidance, counseling, medical care, financial assistance, or other appropriate forms of support.
There is no spiritual virtue in pretending that every problem can be solved without help.
Learning to receive assistance can itself become part of growing in humility.
When You Finally Stop Missing the Person You Had to Pretend to Be
The retired man returns home after volunteering and finds his wife reading in the living room. She asks how the afternoon went, and he begins telling her about someone he helped prepare for a job interview.
He describes the questions they discussed and the confidence the person began developing during the session.
His wife smiles.
She says that he seems happier when he comes home from volunteering.
He considers the observation.
He has been happier, although not because retirement has suddenly become effortless.
He still misses certain parts of his career.
There are days when he wonders whether he retired too early or whether he should have pursued different opportunities.
But he no longer feels that every day without professional authority is evidence that he has become less important.
He is learning to appreciate his experience without requiring everyone around him to recognize it.
He can offer advice without demanding that it be followed.
He can enjoy time with his wife without treating an unstructured afternoon as a failure.
And he can recognize that being loved does not depend upon remaining the person who always has an answer.
That realization has taken time.
He could not simply announce it on the day he retired and expect his emotions to follow.
He needed opportunities to practice a different understanding of himself.
I think something similar happens when our faith begins changing priorities that have shaped our lives for years.
We may understand that wealth cannot save us while still struggling to release the feeling of security it provides.
We may recognize that public approval is not the foundation of our worth while continuing to feel anxious when someone disagrees with us.
We can know that Christ calls us toward humility while still finding correction uncomfortable.
Understanding the truth matters.
Learning to live according to it is an ongoing responsibility.
And there is grace for people who are sincerely pursuing that growth while recognizing that they have not yet become everything they hope to be.
You Don't Have to Know Everything About Tomorrow to Obey Jesus Today
The Gospel of Luke does not give us a detailed account of Zacchaeus's life after Jesus announced that salvation had come to his house.
We do not know what the next morning looked like.
We do not know how he managed every practical consequence of his declaration.
But we should not mistake that silence for a lack of meaning.
The recorded account gives us the central truth.
Jesus came to seek and save the lost.
Zacchaeus responded to Him with joy and with commitments that reflected repentance.
The saving work belonged to Christ.
And the response reached into the practical responsibilities of a human life.
For those of us reading the account today, the question is not whether we can reconstruct every detail of what Zacchaeus did afterward.
It is whether we are willing to respond faithfully within the circumstances of our own lives.
Perhaps the first step is admitting that a habit you once relied upon is now causing harm.
Maybe you need to stop using anger to establish authority.
You may need to become more honest about money, more respectful of someone's boundaries, or more willing to receive help.
Perhaps your challenge is not wrongdoing but a life change that has left you uncertain about who you are.
You may be grieving a career, a relationship, a physical ability, or a role that once gave your days structure and meaning.
Whatever the circumstances, you do not have to pretend that uncertainty makes you worthless.
And when repentance is required, you do not have to know exactly how every consequence will unfold before taking responsibility for what is right.
You can begin with the truth available today.
You can confess sin and trust in the saving grace of Jesus Christ.
You can seek wisdom about practical responsibilities.
You can take the next faithful step without demanding complete control over the outcome.
That is not an invitation to act recklessly.
Responsible decisions may require careful planning, professional guidance, and consideration of how other people will be affected.
But there is a difference between thoughtful preparation and postponing obedience until nothing feels uncertain.
Sometimes uncertainty remains.
We still have to decide what is right.
The man who once depended upon professional authority is learning that he can serve without controlling.
The woman who always carried everyone's responsibilities is discovering that love can exist alongside healthy limitations.
A person who once used silence to punish a spouse is learning to remain accountable during uncomfortable conversations.
None of these changes guarantees an easy life.
But each can become part of a life increasingly shaped by truth, humility, and faith.
And perhaps that is one of the most important things to recognize about becoming different.
The process may feel unfamiliar because the old patterns were familiar, not because they were necessarily good.
We may miss the sense of certainty that came from controlling everything.
We may miss the temporary relief of avoiding difficult conversations.
We may even miss the admiration that came from presenting a version of ourselves that never needed help.
But we do not have to return to those patterns simply because change feels strange.
We can learn another way to live.
The encounter between Jesus and Zacchaeus reminds us that the Savior does not merely offer encouragement while leaving our lives untouched.
His grace calls us toward repentance and faith.
And as we respond, we may discover that something we once considered essential to our identity no longer deserves that place.
There may be grief in that discovery.
There may be uncertainty.
There may be days when the old habits feel easier than the new responsibilities.
But the person we are becoming does not have to be fully familiar before we begin living faithfully.
We can grow into that life one honest decision at a time.
Not because our decisions purchase salvation, but because Jesus Christ has provided the grace upon which our salvation depends.
The retired man no longer needs every room to recognize him as the person in charge.
He still possesses knowledge, experience, and dignity.
But he is beginning to use those gifts with greater humility.
And perhaps that is where the deepest transformation becomes visible.
We stop believing that our familiar identity must be protected at any cost.
We begin recognizing what truly matters.
And through faith in Jesus Christ, we find the courage to become someone whose life increasingly reflects the grace and truth of the Savior.
Chapter 5: The Day You Realize You No Longer Have to Hide From Your Own Life
The woman stood in the hallway outside her son's bedroom, holding a folded piece of paper she had been carrying around for three days. Her son was twenty-six years old, and they had not enjoyed an easy relationship since he left home. They spoke on birthdays and holidays, exchanged occasional messages, and managed to remain polite when family gatherings brought them together. But their conversations rarely moved beyond ordinary subjects. She knew where he worked and how his apartment search was going. She knew he had recently purchased a used car and was considering returning to school. What she did not know was whether he still carried the resentment she remembered seeing in his face during the final years he lived at home. She had spent a long time telling herself that she had done her best as a mother, and in many respects that was true. But she also remembered the nights when exhaustion made her impatient, the arguments she refused to revisit, and the times she used guilt to influence decisions he should have been allowed to make himself.
The paper in her hand was a letter she had written after realizing that she could no longer keep waiting for her son to bring up the past. She had rewritten it repeatedly, removing explanations that seemed reasonable when she wrote them but increasingly sounded like attempts to defend herself. The final version acknowledged several things she knew she had done wrong. It did not ask him to agree with her memories or promise that their relationship would become close again. It simply told him that she recognized ways her behavior had caused hurt and that she was sorry. She wanted him to know she was trying to become more thoughtful and less controlling. Most of all, she wanted to acknowledge what happened without making his response another responsibility he had to carry.
As she stood outside the room, she realized that the letter represented something larger than an apology. For years, she had been protecting an image of herself as a mother who always knew what was best. She believed that admitting she had made serious mistakes would diminish the love and sacrifice she had given her children. But she was beginning to understand that the good things she had done did not need to be erased for the harmful things to be acknowledged. Both were part of the truth. And for the first time, she felt willing to live with that truth instead of spending the rest of her life defending only the parts that made her feel comfortable.
I think there comes a point in our lives when the effort required to avoid ourselves becomes greater than the pain of being honest. We grow tired of remembering which subjects to avoid, which explanations to repeat, and which parts of our history must remain hidden for the person we want others to see to survive. Sometimes our concealment involves wrongdoing. Other times, it involves fear, grief, disappointment, or needs we have convinced ourselves are unacceptable. We may become so familiar with the person we present to the world that we no longer know how to live without constantly protecting that image. The tragedy is that we can spend years maintaining a life that looks reasonably stable while privately feeling disconnected from the very people and convictions that matter most to us.
This is why the encounter between Jesus and Zacchaeus deserves to be remembered for more than the unusual circumstances surrounding a man in a tree. The story is about the Savior who came to seek and save the lost. It reveals the saving purpose of Jesus Christ and the response of a man whose encounter with Him reached into the practical circumstances of his life. Zacchaeus was not merely noticed. He was called personally. He welcomed Jesus joyfully, and the commitments he made afterward revealed a willingness to address generosity and restitution in ways that could cost him something.
There is something deeply meaningful about that movement. The story begins with a man wanting to see Jesus and ends with Jesus explaining why He came. Between those moments, the encounter becomes personal, public criticism emerges, and Zacchaeus responds with commitments that recognize responsibilities beyond his own comfort. Scripture does not tell us every detail of what he thought, how he felt, or what happened during the remaining years of his life. We should not invent those details. But the account gives us enough to recognize a truth that reaches across centuries: the grace of Jesus Christ does not require us to maintain a convincing appearance of righteousness before approaching Him, and receiving that grace should change our willingness to face the truth.
The Life You Keep Explaining Away
A man had been running a small business for twelve years when his accountant identified several problems with the way expenses had been recorded. Some were ordinary mistakes. Others involved decisions the man made because he wanted the business to appear more successful than it actually was. He had moved expenses between reporting periods, delayed recognizing certain obligations, and spoken confidently about financial results that did not fully reflect the company's condition. At the time, he told himself that the business was under pressure and that the irregularities would be corrected when revenue improved. But revenue had not improved enough, and the effort to preserve an appearance of stability had created additional problems.
He was frightened by the possibility of admitting what happened. Employees depended upon the company for income. Customers had made commitments based upon information he provided. His family had invested years of sacrifice in the business. He worried that correcting the records might threaten everything they had built. Yet he was beginning to understand that concealing the truth had already placed those things at risk. Every month he delayed made the situation more complicated, and every explanation he offered required another explanation to preserve it.
What he needed was not another reassuring statement that everything would work out. He needed to face the actual circumstances and seek appropriate accounting and legal guidance about his responsibilities. He might have to correct records, notify affected parties, and accept consequences that could not be avoided. Those steps would be uncomfortable, and they would not guarantee that the business survived. But continuing to conceal the problem would not make it disappear.
There is a painful difference between protecting something valuable and protecting the behavior that threatens it.
The man wanted to protect his employees, his family, and the company he had built. Those were legitimate concerns. But he had begun using their importance to justify decisions that compromised the very trust upon which those relationships depended. He told himself that his intentions were good, and perhaps some of them were. Yet good intentions cannot transform misleading information into truth.
This pattern can develop in relationships as easily as it develops in business. We may conceal an obligation because we want to protect our spouse from worry, while failing to recognize that withholding information prevents the spouse from making informed decisions. We may refuse to discuss a family conflict because we want to preserve peace, while allowing resentment to grow beneath the silence. A parent may defend harsh behavior as necessary discipline, even after recognizing that fear has begun replacing trust in the household.
Sometimes the thing we claim to protect becomes the explanation we use to avoid changing.
That is why repentance requires more than becoming dissatisfied with our circumstances. We must become willing to examine what we have done within them. We may discover that some problems developed through events beyond our control. Others may be connected to choices for which we bear responsibility. Wisdom requires distinguishing between those realities rather than assuming that every hardship is our fault or that hardship excuses every decision.
Zacchaeus's response provides an important biblical picture of that responsibility. He spoke about giving half his goods to the poor and restoring fourfold whatever he had taken through false accusation. His statement recognized that financial conduct could create obligations toward other people. He did not present his wealth as something that placed him beyond moral examination. And he did not suggest that receiving Jesus made those obligations irrelevant.
His encounter with Christ was becoming visible in the way he intended to handle possessions and responsibilities.
When You Stop Requiring Everyone to Understand Why You Did It
A father sits at a restaurant table with his adult daughter after several years of strained communication. He has prepared himself for the conversation because she recently told him that some of his behavior during her childhood still affects her. He remembers working long hours, paying bills, and making difficult decisions while trying to raise a family. He knows there were times when money was uncertain and responsibilities felt overwhelming. He wants his daughter to understand that he was under pressure and that many of his decisions came from a desire to give her a better life.
His daughter listens as he explains those years. Then she tells him that she appreciates the sacrifices he made, but she also remembers how frequently he dismissed her feelings when she disagreed with him. She remembers occasions when he mocked her concerns in front of relatives and made her feel foolish for expressing an opinion. She is not claiming that he never loved her. She is explaining that love did not prevent certain behaviors from causing pain.
The father feels the familiar urge to defend himself. He has explanations for every incident, and some of those explanations contain important context. But he notices that his daughter is not asking him to erase the responsibilities he carried. She is asking whether he can recognize what it felt like to be on the receiving end of his words.
For the first time, he becomes willing to acknowledge that the reasons behind his behavior do not automatically settle the question of whether the behavior was right.
That realization can be extraordinarily difficult because explanations often become part of how we understand ourselves. We know what we intended. We remember the circumstances that made a decision difficult. We can identify ways other people contributed to a conflict. And when someone challenges our conduct, we may feel that they are rejecting our entire experience.
But two things can be true.
We may have been genuinely overwhelmed, and our response may still have caused unnecessary harm. We may have loved someone deeply and still treated that person unfairly. We may have made considerable sacrifices while also developing patterns that damaged trust.
Recognizing those possibilities does not require accepting blame for everything. In a complicated relationship, responsibility may belong to more than one person. Some accusations may be inaccurate, and people can remember the same event differently. We should seek truth rather than automatically surrendering our judgment.
But when wrongdoing is clear, continuing to defend it can prevent us from growing.
The father can acknowledge the specific behavior he recognizes was wrong without declaring that every decision he made as a parent was a failure. He can apologize without demanding that his daughter immediately trust him. He can listen when she explains her experience and accept that some memories may remain painful despite his efforts to change.
He cannot make their relationship healthy through a single conversation. But he can stop treating every discussion about the past as a courtroom in which his innocence must be established.
That is a meaningful kind of freedom.
We no longer have to prove that every decision was justified before accepting responsibility for the ones that were not.
The Difference Between Being Forgiven and Feeling Better
A woman has been carrying guilt about an old friendship that ended after she revealed information shared with her in confidence. She apologized when the truth became known, but the friendship never recovered. Her former friend made clear that she did not want further contact, and the woman has respected that boundary. Years later, she still remembers the incident with embarrassment. Whenever she thinks about approaching God in prayer, she sometimes finds herself returning to the belief that someone who betrayed a friendship so badly should not expect forgiveness.
She has confused the continuing presence of regret with evidence that God's mercy must be unavailable.
The memory remains painful, and perhaps it should continue reminding her of why confidentiality matters. But remembering a wrong decision does not mean she must remain spiritually defined by it forever. There is a difference between taking responsibility and deciding that no amount of repentance could ever matter.
First John 1:9 says, “If we confess our sins, he is faithful and just to forgive us our sins, and to cleanse us from all unrighteousness.”
That promise is grounded in God's faithfulness and justice, not our ability to feel sufficiently ashamed. It does not guarantee that every earthly relationship will be restored. The former friend may never want contact again, and that decision deserves respect. But the woman can confess her sin, trust in the saving work of Jesus Christ, and pursue a life in which honesty and respect for others become increasingly important.
Sometimes people continue punishing themselves because they believe suffering is proof of sincerity. They worry that experiencing peace means they have become indifferent toward the harm they caused. But peace and responsibility do not have to be enemies. A person can recognize the seriousness of wrongdoing without spending the rest of life rehearsing personal worthlessness.
In fact, endless self-condemnation may eventually keep us focused upon ourselves rather than upon the responsibilities and opportunities that remain. We become occupied with whether we deserve forgiveness, whether we feel enough regret, and whether our suffering adequately reflects the seriousness of what happened. Meanwhile, there are people in our lives who need our attention, honesty, and compassion today.
Christian repentance should move us toward God and toward a more faithful life.
It should not become a permanent performance in which we attempt to earn salvation by refusing to experience hope.
Jesus Christ came to seek and save the lost. His death and resurrection provide the foundation for forgiveness. We do not purchase that forgiveness through emotional suffering or good deeds. Ephesians 2:8–9 teaches that salvation comes by grace through faith and is not the result of works.
That truth does not make sin insignificant. It explains why sinners have reason to hope.
The People Who Still Need You Tomorrow
The retired man who struggled to find purpose after leaving his career begins spending Wednesday afternoons helping at a community organization. He assists people preparing for job interviews, reviews résumés, and explains practical workplace expectations. At first, he approaches the work with the same intensity that governed his former professional life. He wants every conversation to produce immediate results and becomes frustrated when people do not follow his advice. Over time, however, he begins recognizing that the people he is helping have circumstances he does not fully understand. Some are recovering from serious illness. Others are managing childcare, transportation problems, or financial pressures that make employment decisions more complicated than they appear.
He starts listening more carefully. Instead of assuming that every problem has a simple solution, he asks questions and considers what support might be useful. He discovers that his experience still has value, but it becomes more meaningful when offered with patience rather than authority. He no longer needs to be the person who controls the outcome. He can provide guidance, encourage someone who is discouraged, and accept that the final decision belongs to the person he is helping.
That change begins influencing his life at home as well. His wife notices that he asks about her day without immediately offering solutions. He becomes more comfortable acknowledging uncertainty. When his grandchildren visit, he spends less time directing their activities and more time enjoying what interests them.
He is still learning.
There are days when old habits return, and he becomes impatient. Sometimes he misses the professional environment where his decisions carried authority. But he is beginning to understand that the value of his life did not disappear when his title did.
This is one of the quieter possibilities that comes with spiritual and personal growth. We can begin using the abilities God has allowed us to develop in ways that are less concerned with personal recognition. The skills remain, but their purpose changes. Experience becomes an opportunity to serve rather than a reason to feel superior. Financial resources become something to steward rather than proof of our worth. Time becomes a gift to use thoughtfully rather than an empty space that must always be filled with achievement.
None of this means that work, professional success, or financial security is wrong. Those things can serve worthwhile purposes. People need stable employment, and providing for a household is an important responsibility. But when possessions, status, or achievement become the foundation of identity, we may begin protecting them at the expense of the people they were meant to benefit.
Jesus' teaching in Luke 12:15 reminds us that a person's life does not consist in the abundance of possessions. The warning challenges us to consider what makes life meaningful beyond accumulation.
Zacchaeus was wealthy. His response to Jesus involved a substantial willingness to give and restore. The meaning of his possessions was changing within the account because his commitment was now connected to generosity and the rights of other people.
We do not know what his life looked like afterward. But we know enough to understand that meeting Jesus was not merely an experience he could admire and leave behind. The response reached into practical matters.
For us, the same principle may appear in different circumstances. We may become more honest in business, more patient at home, more generous with our resources, or more willing to acknowledge mistakes without protecting our pride. These decisions may seem ordinary, but they can reveal a changed understanding of what matters.
The Courage to Live Without Everyone's Approval
A woman has been considering returning to school after years of believing she was not capable of completing a degree. She left college when she was younger because family circumstances required her to work full-time. Since then, she has raised children, held several jobs, and developed practical skills that have served her well. But she has always regretted leaving her education unfinished.
Now that her circumstances have changed, she wants to take a few courses.
Some people encourage her.
Others question whether it makes sense at her age. They worry about tuition costs, time, and whether the effort will produce a meaningful professional benefit. Their concerns are not necessarily unreasonable. Education can be expensive, and thoughtful planning matters.
But the woman begins recognizing that she has spent years allowing other people's reactions to determine whether her interests deserve attention. She can evaluate the practical issues without treating every expression of doubt as a final verdict upon her abilities.
She researches affordable programs, considers her financial responsibilities, and develops a realistic plan.
She may decide to enroll, or she may discover that another form of education better fits her circumstances.
The important change is that she begins taking responsibility for evaluating her own future rather than assuming that someone else's uncertainty means she should abandon the possibility.
There is a connection between this kind of growth and the freedom that comes from no longer treating human approval as our ultimate source of security.
We should listen to wise counsel.
We should remain willing to acknowledge mistakes and consider concerns raised by people who know us.
But we cannot build a faithful life upon the requirement that everyone understand every decision we make.
Some people will disagree with us even when we have acted responsibly.
Others may continue remembering a version of us that no longer reflects our conduct.
And there may be people whose approval we will never obtain, no matter how carefully we explain ourselves.
That reality can be painful, especially when the people involved are members of our families or individuals whose opinions matter deeply to us.
But their approval cannot become our savior.
We need a foundation greater than the constantly changing judgments of human beings.
For Christians, that foundation is Jesus Christ.
Galatians 1:10 challenges the effort to please people when doing so conflicts with serving Christ. It reminds us that faithfulness to God must remain more important than satisfying every expectation placed upon us.
That does not mean we become indifferent to others. Love requires attention to how our decisions affect people. We should honor legitimate obligations and remain open to correction.
But love is not the same as surrendering all moral judgment to another person's approval.
And humility does not require making everyone else's opinion more important than what Scripture teaches.
What Remains When the Performance Ends
The woman who spent seventeen years hiding her unhappiness behind an agreeable personality has begun speaking more openly with her husband. Their marriage is not suddenly effortless. Some conversations become uncomfortable, and they occasionally discover that their expectations are more different than either realized. There are days when she misses the simplicity of saying everything is fine, even when it is not. Honesty requires more patience, and sometimes it reveals problems that silence previously concealed.
But she is also beginning to feel more known.
Her husband is learning that her preferences matter and that her silence did not always indicate agreement. She is learning that expressing a concern does not have to become an accusation. They are discovering that closeness may require conversations that are less comfortable but more truthful than the ones they had before.
The process has revealed something important. Their relationship was never strengthened by the fact that she disappeared behind the role of the agreeable wife. The relationship becomes healthier when both people are willing to recognize the other's experience and respond with care.
Not every relationship can safely follow that pattern, and we should never use it to encourage someone to disclose vulnerable information to a person who may respond with abuse or coercion. But where mutual respect exists, greater honesty can create a kind of closeness that constant performance never provides.
I think many of us long for that kind of freedom.
We want to know that we can be loved without pretending that we never struggle.
We want to acknowledge mistakes without believing that doing so will destroy every good thing people see in us.
We want relationships in which responsibility matters but perfection is not required.
And spiritually, we want to approach God without carrying the exhausting belief that we must first create a version of ourselves worthy of His attention.
The Gospel offers something far greater than human acceptance.
It offers salvation through Jesus Christ.
His saving grace is not based upon the success of our performance. It does not require us to convince Him that we have never sinned. He came precisely because humanity needed a Savior.
And because He knows our need, we can approach Him honestly.
We do not have to disguise wrongdoing as misunderstanding.
We do not have to pretend that every painful circumstance was caused by our own failure.
We can distinguish between the burdens we are carrying and the responsibilities we need to address.
We can seek His forgiveness when we have sinned and His comfort when we are suffering.
And we can allow His truth to shape the decisions that follow.
The Meaning of Being Called Down From the Tree
Luke 19 tells us that Zacchaeus wanted to see Jesus. Because he was short and the crowd prevented him from seeing, he climbed a sycomore tree. When Jesus reached that place, He looked up and called Zacchaeus by name.
Luke 19:6 says, “And he made haste, and came down, and received him joyfully.”
The crowd complained about Jesus entering the home of a sinner. But the encounter continued, and Zacchaeus made his remarkable declaration concerning generosity and restitution.
Then Jesus explained the greater significance of what had happened.
Luke 19:10 says, “For the Son of man is come to seek and to save that which was lost.”
I believe that final statement is the part we must never lose.
Jesus did not come merely to offer Zacchaeus an opportunity to improve his public reputation. He did not come because wealth or professional status made the man deserving of salvation. He came as the Savior whose mission was to seek and save the lost.
The declaration of salvation in Luke 19:9 directs our attention toward Christ, not toward a financial formula by which Zacchaeus earned forgiveness.
The generosity and restitution mattered because they reflected a response to the encounter.
But Jesus was the Savior.
That remains true for us.
We may need to make difficult changes. We may need to apologize, repay debts, establish healthier habits, or surrender attitudes that have caused harm. There may be consequences that continue despite sincere repentance, and there may be people who are not willing or able to restore relationships with us.
Those realities deserve honesty.
But none of them changes the foundation of Christian salvation.
We are saved by God's grace through faith in Jesus Christ, not by the perfection of our behavior.
That grace should move us toward obedience, but our obedience does not replace our dependence upon Him.
And perhaps this is one of the deepest reasons we can stop hiding.
The Savior does not need us to produce a flawless personal history before coming to Him.
He already knows that sinners need salvation.
We can bring the truth of our lives before Him.
We can admit where we have failed.
We can seek forgiveness and become willing to address the responsibilities that remain.
And we can trust that our hope is grounded in His saving work rather than our ability to convince everyone that we have always been good.
The Letter That May Never Receive an Answer
The woman standing outside her son's bedroom eventually places the folded letter on the table beside her and sits down. She rereads it one final time, paying particular attention to the closing paragraph. She has written that she loves him and hopes they can develop a healthier relationship, but she has also made clear that he is not obligated to respond in any particular way.
She knows that sending the letter will not automatically repair the distance between them.
He may appreciate the apology but remain cautious.
He may want to talk about memories she finds difficult.
Or he may decide that he needs more time.
She cannot control those possibilities.
Before reaching out, she considers the boundaries he has established. If he has asked for no contact, respecting that request may mean keeping the letter rather than delivering it. Repentance does not give her permission to disregard his wishes simply because she now wants reconciliation.
That realization is painful.
But she begins understanding that becoming a more loving mother may require caring about what her son needs more than obtaining the response that would make her feel forgiven.
She can continue changing whether or not he witnesses every part of that change.
She can become more thoughtful in the way she speaks with other family members.
She can recognize the difference between offering guidance and trying to control someone else's decisions.
She can receive correction without immediately becoming defensive.
And she can stop measuring her worth entirely through whether her adult children respond as she hopes.
This is not an easy kind of peace.
It does not promise that every relationship will become close again.
But it allows her to live truthfully.
She no longer has to defend behavior she knows was wrong.
She can acknowledge the good she tried to do without using it to erase the harm she caused.
And she can continue becoming someone whose love is less dependent upon control.
Sometimes that is what growth looks like after many years of hiding behind a familiar identity.
We discover that the truth does not require us to despise ourselves.
It requires us to become willing to live honestly.
The Day You Finally Stop Hiding
I want to finish with the person sitting quietly at the end of a difficult day, carrying something that nobody else fully understands. Perhaps there is an apology you have been postponing. Maybe you are frightened about money, exhausted by responsibilities, or discouraged because your life has moved in a direction you never expected. You may be struggling with the consequences of decisions you genuinely regret. Or perhaps you have been mistreated and have begun believing that what happened to you somehow determines your value.
Those circumstances are not all the same.
Someone who has been harmed needs compassion and should not be assigned responsibility for another person's wrongdoing.
Someone who has caused harm needs to recognize that repentance involves more than feeling sorry.
And someone whose life has become overwhelming may need practical assistance, rest, and appropriate support rather than another accusation that they are not trying hard enough.
But whatever the circumstances, there is a truth in the Gospel that reaches beyond the image we have constructed.
Jesus Christ came to seek and save the lost.
He knows the reality of human sin.
He understands our need for forgiveness.
And His saving grace cannot be earned through wealth, reputation, achievement, or the ability to appear strong.
We do not have to hide our need from the Savior.
We can approach Him honestly.
If we have sinned, we can confess it and turn toward Him in repentance and faith.
If we have harmed someone, we can seek to address that responsibility in an appropriate and truthful way.
If we are suffering, we can ask for help without pretending that needing help makes us less worthy of dignity.
And if we have spent years measuring our value through the opinions of other people, we can begin learning to ground our hope in something that does not change with every reaction we receive.
The woman at the kitchen table may never recover every opportunity she missed with her son. The business owner who corrects dishonest records may face serious consequences. The retired man learning to serve without controlling may continue struggling with the loss of his former identity.
None of these lives becomes effortless through a single realization.
But each person can begin living more truthfully.
And that matters.
There is a difference between having a perfect life and having a life in which we are no longer determined to conceal everything imperfect about us.
There is a difference between receiving universal approval and becoming genuinely trustworthy.
And there is an immeasurable difference between attempting to save ourselves through good works and trusting the Savior who came because we could not save ourselves.
Zacchaeus climbed a tree because he wanted to see Jesus.
Jesus stopped and called him personally.
The man came down and received Him joyfully.
And the encounter led to a response that reached into the resources and responsibilities of his life.
The final word belonged to Jesus, who explained that the Son of man came to seek and save the lost.
That is the hope I want you to carry beyond this article.
You do not have to become impressive enough to deserve a Savior.
You need Jesus Christ.
You do not have to spend the remainder of your life making every past decision look justified.
You can acknowledge what was wrong and begin living differently.
You do not have to treat the pain you are carrying as something that must remain invisible for other people to love you.
You can seek appropriate help, develop honest relationships, and recognize your own humanity.
And when tomorrow arrives, with all its responsibilities and uncertainties, you can face it without returning automatically to the person you once believed you had to pretend to be.
Maybe there will still be difficult conversations.
Maybe some people will remain disappointed.
Perhaps a relationship will never recover, or a financial responsibility will require years of effort to resolve.
Those realities may be painful.
But they do not place you beyond the reach of Christ's saving grace.
He came to seek and save the lost.
And when that truth becomes the foundation of our lives, we can begin letting go of the exhausting effort to appear like someone who never needed saving.
We can become more honest.
We can become more compassionate.
We can learn to take responsibility without living permanently condemned by our past.
And we can trust Jesus Christ with the parts of our lives we once believed were too difficult, too embarrassing, or too damaged to bring into the light.
The woman with the folded letter does not know whether her son will read it.
The man who finally tells his wife about his fear does not know whether his job will remain secure.
The retired professional does not know what every remaining year of life will bring.
But each can stop pretending that uncertainty must be concealed.
Each can choose a more truthful response to the responsibilities of today.
And each can discover that a life shaped by the grace of Jesus Christ does not have to depend upon maintaining the appearance of having everything under control.
Sometimes the freedom we have been searching for begins when we finally admit that we cannot save ourselves.
And discover that we were never meant to.
Your friend, Douglas Vandergraph
Explore the complete Douglas Vandergraph Master Index: https://douglasvandergraph.com/douglas-vandergraph-master-index/
Watch Douglas Vandergraph’s faith-based videos on YouTube: https://www.youtube.com/@douglasvandergraph
from ‡
these waters are unfamiliar to me and run deep. who are you?
from  G A N Z E E R . T O D A Y
WHERE THEY CREATE is a blog, book, and Youtube channel which unveils the working spacing of artists, architects, and other creative types. My new porn has been found.
#radar
Friday
from  Roscoe's Story
In Summary: * Spent a few relaxing hours this afternoon hanging out on the MLB Network, enjoying their extended preview of the upcoming World Series. In about half an hour I'll be doing that again in preparation for tonight's first game which is scheduled to start at 7:00 PM CT. Don't know if I'll be able to stay with all nine innings, the brain may fog over and send me to bed before the game's over, but I'll stick with it for as long as I can.
Prayers, etc.: * I have a daily prayer regimen I try to follow throughout the day from early morning, as soon as I roll out of bed, until head hits pillow at night.
Health Metrics: * bw= 212.31 lbs. * bp= 126/81 (54)
Exercise: * morning stretches, balance exercises, kegel pelvic floor exercises, half squats, calf raises, toe raises, wall push-ups, BP breathing exercises, pilates
Diet: * 04:05 – 1 banana * 06:00 – 1 peanut butter sandwich * 09:00 – snacking on deli cheese cubes * 11:20 – cole slaw, fried chicken * 14:10 – 1 peanut butter sandwich * 15:30 – 1 fresh apple
Activities, Chores, etc.: * 02:10 – listen to local news talk radio * 03:25 -read, write, pray, follow news reports from various sources, surf the socials, take daily meds, unpack, organize * 05:50 – bank accounts activity monitored * 11:00 – listening to Indiana Football Friday * 12:30 – watching MLB Central on MLB Network * 16:00 – follow news reports from various sources, surf the socials
Chess: * 07:05 – moved in all pending CC games