Want to join in? Respond to our weekly writing prompts, open to everyone.
from Unvarnished diary of a lill Japanese mouse
JOURNAL 3 août 2026
La nuit est chaude. Pas de ciel Pas d'étoiles Nuit noire tout autour On s'est assise pour regarder sur la mer. Au loin les lumières clignotantes. Je suppose que c’est la distance et le mouvement des bateaux qui produisent cette impression. Petites lucioles aux parcours mystérieux.
On aime être comme ça, côte à côte, en silence, à contempler le monde. C'est presque de la méditation On se sent si petites L'océan produit une idée précise de l'immensité de l'univers et forcément nous rappelle la fragilité et la brièveté de nos vies.
Alors on se donne la main pour se rassurer en silence
Sommer ❤️.
from Küstenkladde
⚓️ Poesie.
Gerade noch saßen sie da,
die Segler,
in offenen Camper vor ihren Wäscheleinen,
an denen die Taucheranzüge im Wind flatterten.
Aus aller Herren Länder leuchteten die Flaggen
international in den kleinen Küstenort.
Gerade noch zogen sie morgens ihre Boote
über den Sand ins Meer und doch sind sie jetzt
wieder fort, setzen an anderer Stelle ihre Segel,
fortgeweht wie die gelben Blätter, die über die Promenade
wehen.
Die Einheimischen gehen wieder ihrem Alltag nach,
schwimmen im Morgenlicht,
treffen sich auf der Promenade zum Boule,
oder auf dem Markt.
Es ist, als hätte es die Travemünder Woche nie gegeben.
🌊 Strandgut.
Wenn die Segler sich auf dem Meer tummeln oder die großen Pötte am Horizont sichtbar werden, näher kommen und sich am kleinen Leuchtturm vorbeischieben, geht mir das Herz auf. Während ich über die Promenade radle, entsteht in mir das Gefühl, auf dem Strand zu leben. Ich fühle das Vibrieren der Menschen, die ihre Köpfe in die Sonne halten, die eine Sommernacht durchtanzen, die ihre Subs ins Meer schieben … Die Melodie von Gershwins “Summertime” erklingt in meinem Kopf, und gleich setze ich mich ans Klavier und klimpere sie nach.
Gleichzeitig erinnere ich mich an frühere Strandaufenthalte in anderen Teilen der Welt. An Zelturlaube in Frankreich, an eine kleine Familienpension in Italien, an Sportsbars auf Hawaii und es entsteht ein Gefühl der Verbundenheit mit meinem früheren Dasein und den Küsten untereinander. Weltumfassend.
📖 Gelesen. Gesehen. Gehört.
Haben oder Sein – Die seelischen Grundlagen einer neuen Gesellschaft von Erich Fromm – Das Buch ist mir in einem Büchertausch-Regal in die Hände gefallen und hat mich von den ersten Seiten an, in den Bann gezogen, weil die Auseinandersetzung mit der Frage nichts an Aktualität verloren hat. Im Gegenteil!
Eine feine Überraschung war der Film “The Map that leads to you” (Liebe findet uns). Der Film erzählt die Geschichte von Heather, die mit Freundinnen durch Europa reist, bevor ihr perfekt geplantes Leben beginnen soll. Der Film war für mich persönlich nicht nur ein wundervoller Flashback an vielfältige Europareisen kreuz und quer mit dem Zug, sondern auch die Entdeckung des Schriftstellers J.P. Monninger, der den Roman geschrieben hat und damit auf wundervolle Weise Hemingways Roman “Fiesta” verarbeitet. Das Leben ist ein Fest! Die stilvolle Machart des Films ist dem schwedischen Regisseur Lasse Hallström zu verdanken.
Copenhagen Cinnamon von Stefanie Neeb entführt die Zuhörenden in die herbstlichen Viertel der dänischen Hauptstadt bis hin zum Küstenort Rungsted, wo die Schriftstellerin Karen Blixen gelebt hat. Zwischen Kaffee und Zimtschnecken knistert es zwischen den Hauptfiguren Mads und Jonna vor der Kulisse eines gemütlichen Coffee Shops.
☕️ Zum Schluss.
… eines meiner Lieblingszitate in “Haben oder Sein”:
“Es gibt kein Sein, das nicht gleichzeitig ein Werden und sich verändern ist. Lebende Strukturen können nur sein, indem sie werden, können nur existieren, indem sie sich verändern. Wachstum und Veränderung sind inhärente Eigenschaften des Lernprozesses.”
Tension as Structure
 An Essayist's Notebook
Starting with a tension and staying with it long enough for something previously invisible to become visible has increasingly become the centre of my writing practice.
The essay linked below is an example of that approach. It begins with work that shaped my belief in the possibilities of dialogue, participation and persuasion, then follows a line of enquiry towards a conclusion I had resisted for many years.
Rather than resolving the tension, the piece attempts to remain with it long enough for its underlying structure to reveal itself.
Published in The Marshall Review: rvw.ie Read the essay
 David Marshall
Sna Sceirí
David Marshall
Sna Sceirí
The Slow Arrival of a Difficult Truth
from  The Marshall Review
When argument has nothing to stand on
Some years back I was awarded a DPhil for work I had published two decades earlier, work that was judged to make an original contribution to knowledge. The first revealed a structure for presenting a defence of nurses accused of wrongdoing. It explored how to advance an argument inside a recognised hierarchy with actors who largely behaved with integrity. The second revealed a structure for engaging public sector workers in discussion. It examined how people could draw on their own experience and develop their opinions about a major shift in government policy that would affect both their work and their representation.
In both pieces of work the environments carried a particular character. A kind of liberal consensus that was so familiar at the time that we barely noticed it. In the tribunal cases the hierarchy itself provided the frame. Everyone in the room recognised the authority of the structure. Everyone understood the rules and the evidential standards. Everyone behaved broadly with enough integrity for argument to matter. It was possible to advance a defence because the structure could hold the weight of disagreement. Power was present of course. It always is. But it was channelled and contained. Given form by the procedures that governed the room. Argument belonged there because the environment itself supported the activity of argument.
The second situation shared the same assumptions though expressed differently. These were not formal hearings but part of a national conversation involving more than 650,000 public sector workers attempting to make sense of a significant policy shift. There was no hierarchy and no tribunal procedure. There was however mutual recognition. Despite the scale of the undertaking people listened because they recognised their own concerns in those of others. They were willing to explore and revise their views because the structure we built together made that possible. Their opinions shifted not because one person persuaded them but because they persuaded each other. Consensus emerged because the conditions allowed it. Shared experience. Trust in the process. A sense that everyone was participating in good faith.
Power was present here too but moderated by familiarity and reciprocity. Both environments rested on the same quiet assumptions. That argument is meaningful. That persuasion is possible. That norms are broadly shared. That the structures we inhabit can contain the power within them. These were not abstract ideals. They were the material conditions that made argument possible. They shaped the liberal imagination of the time and they shaped my own understanding of how people reason together. They convinced me that though we may differ in our wants needs and desires there is often a path to resolution if we place in our way the machinery through which disagreement can be managed. The participation of everyone involved is not incidental to that process. It is one of its essential ingredients.
At the same time as those two pieces of work and for some years afterwards I was engaged in a programme I titled Tackling Racism. That work took me into closed rooms where regard for others was not shared in the way it had been in tribunals or workplace discussions. The assumptions that had quietly underpinned those earlier environments were simply absent. The expectation that people would listen. The expectation that they would recognise each other. The expectation that they would accept the legitimacy of the process itself. In those rooms the role of some participants emerged very quickly. A desire to bully. To intimidate. To dominate.
These were not the anti-racism workshops familiar in workplaces and trade union halls where we were often dealing with prejudice born of distance or unfamiliarity. Misunderstandings that could sometimes be worked through. These meetings were different. For some participants they became opportunities for larger scale bullying and repression. The same behaviours that had already shown themselves in abuse directed at individuals on the shop floor in corridors in car parks and on the street. The structure could not contain it.
Sometimes a realisation arrives in an instant. Sometimes it comes slowly as if the mind is adjusting itself grain by grain. This one arrived neither way. It was prolonged. And it was punishing. I denied it. I fought it. I kept returning to the belief that there had to be a way. That if I could only find the right structure the right approach the right moment then the same regard for others that had shaped my earlier work would re-emerge. I had seen people change their minds. I had seen consensus form. I had seen argument work. Surely it could work here too.
But the more I failed the more I felt the realisation rising. Not as an idea but as a physical sensation. Something welling up from the pit of my stomach. The assumptions I had carried from those earlier environments simply did not apply. The quiet respect for others. The willingness to listen. The expectation of integrity. The belief that everyone in the room was engaged in the same activity. None of these could be assumed.
What confronted me was not a breakdown in argument. It was the absence of the conditions that make argument possible.
I had spent years believing that good structures could enable disagreement to become something productive. That if people could be brought into the same space then understanding could emerge. That persuasion remained possible.
What I discovered was the limit of that belief. Argument is not a universal tool. It depends upon conditions that cannot be assumed. It depends upon structures capable of holding power. It depends upon shared norms however imperfect. It depends upon a willingness to recognise others not merely as opponents but as participants in a common endeavour. Remove those conditions and argument does not fail.
It ceases to exist.
David Marshall
Sna Sceirí
from Sprachabenteuer
Humboldt Forum: 18. Juli
Gestern haben wir mit Nandita bis zwei Uhr nachts geredet. Als heute Morgen der Wecker um sieben Uhr klingelte, fühlte ich mich, als hätte ich den Kopf voller Sand. Ich bin mir allerdings nicht sicher, ob dieses Bild auf Deutsch überhaupt etwas bedeutet. Auf Litauisch beschreiben wir diesen Zustand – wenn der Kopf einfach nicht richtig funktioniert – mit zwei Redewendungen. Entweder sagen wir, dass jemand „wie mit einem Sack geschlagen“ aussieht, oder eben, dass er „einen Kopf voller Sand“ hat. Darüber muss ich unbedingt noch mit meinen deutschen Freunden diskutieren. Übrigens beziehen sich beide Redewendungen eigentlich auf den Zustand nach einer durchfeierten Nacht mit Alkohol.
Nandita trinkt allerdings überhaupt keinen Alkohol. Sie trinkt nicht einmal Kaffee oder Tee – nur Wasser. Ich dagegen trinke je nach Stimmung eigentlich alles, meistens allerdings in Gesellschaft von Freunden, die ebenfalls Alkohol trinken. Mit Nandita braucht man jedoch überhaupt keinen Alkohol. Nach einem Abend mit ihr fühlt man sich auch ganz ohne das, als hätte man viel zu viel getrunken!
Zunächst noch ein paar Worte über unsere Hunde. Früher hatte Nandita in Indien große Angst vor Hunden. Deshalb fühlt sie sich selbst mit unseren Hunden noch etwas unwohl, obwohl sie sich eigentlich überhaupt nicht für sie interessieren. Wie ich schon erzählt habe, reagiert Pipiras allerdings sehr empfindlich auf neue Menschen und ungewöhnliche Situationen. Als Nandita ankam und laut rufend auf mich zugelaufen kam, fing Pipiras sofort laut an zu bellen. Dadurch bekam Nandita noch mehr Angst und versuchte förmlich, auf mich hinaufzuklettern. Pipiras wiederum war überzeugt, dass sie mich angreifen wollte, und bellte noch lauter. Am Ende war die ganze Rezeption voller Lärm. Eigentlich, würde ich sagen, ist Nandita die menschliche Version von Pipiras. Sie hat ebenfalls eine unglaublich laute Stimme. Wenn die beiden gleichzeitig aus Angst ihre Sirenen einschalten, könnte man wirklich einen Großalarm auslösen. Zum Glück gelang es mir, beide Sirenen wieder auszuschalten, und wir konnten endlich spazieren gehen.
Mindaugas fühlte sich heute leider nicht besonders gut. Deshalb gingen Nandita und ich allein mit den Hunden zur Morgenrunde. Endlich stellte Nandita fest, dass unsere Hunde sich überhaupt nicht für sie interessieren – solange sie nicht schreit. Deshalb konnten unsere Nachbarn am Samstagmorgen endlich wieder etwas ruhiger schlafen. Unser Plan für heute war, ein bisschen Arbeit mit ein bisschen Vergnügen zu verbinden.
Wir gingen noch einmal zur Museumsinsel. Nach dem Frühstück wollte ich dort eine weitere Wegbeschreibung testen. Ich wusste schon vorher, dass das wieder viel Zeit kosten würde. Deshalb beschlossen wir, den Tag zunächst ganz entspannt mit einem Frühstück zu beginnen. Dabei entdeckten wir ein wirklich schönes Café in der Nähe des Berliner Doms. Leider war es für Mindaugas nicht besonders gut zugänglich, weil es sich halb im Keller befand. Aber wenn er zu Hause geblieben ist, konnte ich auch ein bisschen die unzugängliche Orte kennenlernen. Die Panini und die Waffeln waren wirklich lecker – und dazu noch überraschend günstig.
Dieses Mal beschäftigte ich mich mit der Wegbeschreibung zum Humboldt Forum. Alle Einzelheiten werde ich diesmal nicht beschreiben, trotzdem möchte ich ein paar Beobachtungen zusammenfassen:
Dieses Mal musste ich einen anderen Ausgang aus dem U-Bahnhof finden. Da ich das System der Treppen inzwischen schon viel besser kannte, klappte das erstaunlich gut. Die Wegbeschreibung führte mich zum Treppenaufgang. Allerdings wurde nicht erwähnt, dass sich die normale Treppe zwischen zwei Rolltreppen befindet. Ich vermute, dass das für die Berliner ohnehin selbstverständlich ist – nur ich musste erst einmal lange danach suchen.
Vor dem zweiten Treppenaufgang sollte ich zweimal rechts entlang gehen und dabei eine Wand auf meiner rechten Seite haben. Den Treppenaufgang fand ich allerdings eher nach einer Rechtskurve. Ist das falsch? Hoffentlich nicht. Da ich die ganze Zeit die Wand auf meiner rechten Seite hatte, war ich ziemlich überzeugt, auf dem richtigen Weg zu sein, und fand den Fußgängerweg auch recht schnell.
Anschließend musste ich im Innenhof wieder ein Leitsystem finden. Aber auf welcher Seite? Und wohin sollte mich dieses Leitsystem überhaupt führen? Das wurde leider nicht erklärt. Also ging ich einfach „bis zum Leitsystem“, wie es in der Beschreibung stand, und folgte anschließend der metallenen Ablaufrinne bis zum Humboldt Forum.
Nandita filmte mich diesmal von außen. Eigentlich verlief fast alles richtig. Nur die Glastür am Ende fand ich nicht. Nandita erklärte mir schließlich, dass ich mich inzwischen auf der anderen Seite des Gebäudes befand. Wir überprüften die Beschreibung noch einmal gemeinsam. Da wir das System selbst noch nicht ganz verstanden hatten, beschlossen wir schließlich, die Suche zu beenden und stattdessen einfach über die Museumsinsel zu spazieren.
Außerdem wussten wir bereits, dass das Humboldt Forum an diesem Tag ein Berliner Festival veranstaltete und wir am Abend zu einem Konzert willkommen sein würden. Darüber freuten wir uns sehr – wir wollten den Abend einfach mit Musik, Tanzen und guter Stimmung genießen. Nach unserem Spaziergang und ein paar Fotos vor Ort waren wir ziemlich müde. Deshalb legten wir uns auf eine der erstaunlich bequemen Bänke auf der Museumsinsel. Dort kann man sich wirklich wunderbar ausruhen. Gleichzeitig konnten wir noch ein bisschen die Sonne genießen.
Was den Spaziergang mit Nandita außerdem besonders macht: Sie kommt unglaublich leicht mit Menschen ins Gespräch. Die ganze Zeit bat sie irgendwelche Passanten, Fotos von uns zu machen, und stellte mich anschließend vor den verschiedensten Gebäuden der Museumsinsel auf. Während unserer kleinen Pause erzählte sie mir von den Fotos und freute sich darüber, dass wir so nette und talentierte Fotografen gefunden hatten. Dabei wurde mir auch bewusst, dass ich mich im Zentrum von Vilnius wahrscheinlich gar nicht so entspannt erholen könnte. Dort kennen mich einfach zu viele Menschen, und deshalb habe ich oft das Gefühl, mich etwas „ordentlicher“ verhalten zu müssen. Hier in Berlin dagegen genieße ich es, einfach auf einer Bank zu liegen und mich zu entspannen. Nandita brachte uns außerdem Pommes und Kaffee, und unsere kleine Sommerpause wurde dadurch noch gemütlicher und lustiger. Die Sonne wechselte sich übrigens ständig mit einem angenehm kühlen Wind ab. Manchmal war uns richtig warm, im nächsten Moment wieder kühl. Ich vermutete allerdings mit Sorge, dass das genau die Art von Wetter ist, bei der man sich besonders leicht einen Sonnenbrand holt.
Zur Mittagspause kehrten wir ins Hotel zurück. Dort wollten wir uns noch etwas ausruhen, Mindaugas etwas zu essen bringen und außerdem einen kleinen Auftrag für die Universität erledigen. Ich bin Studierendenvertreterin und muss deshalb regelmäßig kleine Tests zu universitären Themen absolvieren. Darin geht es zum Beispiel um Fragen wie: Wie viele Vertreterinnen und Vertreter gibt es im Studierendenparlament? An wen kann ich mich bei Problemen im Studium wenden? Wo finde ich welche Informationen? Eigentlich sind diese Tests gar nicht so einfach, weil man sich an viele offizielle Einzelheiten erinnern muss. Die meisten Informationen hatte ich allerdings schon früher gesammelt. Deshalb konnte ich den Test innerhalb einer knappen Stunde abschließen und meine Qualifikation als Studierendenvertreterin wieder verlängern.
Am Abend erwartete uns schließlich ein wunderschönes Konzert. Es traten mehrere Bands aus Korea auf. Die Sängerinnen waren unglaublich sympathisch und verstanden es hervorragend, mit dem Publikum zu kommunizieren. Ich kannte koreanische Musik bisher kaum. Sie klang für mich zunächst etwas fremd, wurde aber gleichzeitig auf eine sehr attraktive Weise präsentiert. Besonders die Art zu singen fand ich faszinierend. Gemeinsam mit dem unglaublich freundlichen Berliner Publikum verbrachten wir einen wunderschönen Abend. Später gingen wir noch ein Eis essen und anschließend bis zum Alexanderplatz spazieren. Draußen waren unglaublich viele Menschen unterwegs. Ähnlich wie tagsüber waren alle mit den unterschiedlichsten Dingen beschäftigt – so verschieden und doch oft irgendwie einsam. Der Alexanderplatz wirkte auf mich wie ein gemeinsamer Treffpunkt all dieser Unterschiede. Und genau deshalb fühlte es sich schön an, selbst ein kleiner Teil dieser Vielfalt zu sein. Dieses Gefühl erlebe ich immer wieder in großen Städten. Ich habe den Eindruck, dass ihre Bewegung, ihre Geräusche und ihre Atmosphäre mir helfen, den Mangel an visuellen Informationen irgendwie auszugleichen. In der Natur empfinde ich das anders. Dort entdecke ich wiederum andere wunderbare Dinge. Aber die Stadt ist für mich wie ein ganz besonderer Teil meines Inneren.
So kamen wir schließlich mit sommerlichen, städtischen, freundlichen und fröhlichen Eindrücken nach Hause zurück.
Dear Diary - Day 60
from hypocritepoet
epigraph
Some days...
Granja landing in me: Observations and Thoughts
from hypocritepoet

The harder I adventure, the more I see there is to adventure.
December 2025
This is a collection of semi-readable notes from my first days in Portugal. Once settled, we moved from our hotel to stay with friends just south of Porto in Granja, Portugal. On one hand it's removed from the classically historic part of the city. On the other, We're living with locals, like a local. NO one speaks more english than 'yes' or 'no' or 'no English'!
So I'm buying bread and reading Portuguese poorly from my translation app.
They also live 4 blocks from the ocean. Not bad all things considered.
We have been on the Iberian peninsula for 6 days at this point. Jet lag is slowly fading, but just as I adapt to the new circadian rhythm, client work materializes and I've suddenly got to function living on WET while working on PST.
Wednesday Dec 17, 2025
I clawed from bed early and dashed into the winter light for a fifteen-minute walk. Then dashed into the city for a meeting with friends to organize for a public preaching. We are all volunteer Bible teachers and I was excited to engage in a new country.
After our meeting to organize at 10am, I left the apartment and went next door to buy an orange from one of the small shops that are ubiquitous here. I only had a twenty-euro bill, but the total was something like twenty cents. The shopkeeper just waved his hand and said, “You take.”
Yayyyy! Free orange.
Our ministry was refreshing and different. None of us are natives, so our 'territory' for preaching is english-speakers. Ex-pats, Africans and Indians. All foreigners. You can do a little racial profiling based on skin color, and generally, you'll find they are English speakers.
However, it isn't just thump them with a Bible and they love you. It is very important to just have a conversation. English speakers who are foreigners, LOVE to meet other foreign english-speakers. We're all in the same boat, essentially: We are accepted, even liked, but truth be told, the natives would rather we buy a magnet and then go back home.
And so, the common ground is just, 'hey, you're safe with me'. Not that Portuguese people aren't wonderful. They are. But, the world is a challenging place, and anything different creates friction.
So if we find a potential english speaker, we connect based solely on that point. As the conversation progresses, we look for ways to shift it to spiritual topics. Not hard, but not everyone is interested. So, sometimes you just talk about where you are from, the weather and what they think of the place, and you move on.
It's a very slow, meticulous work.
We have several enjoyable conversations and I meet a Catholic who is a Bible scholar and specializes in the first 300 years of the Catholic church. In the US, I RARELY meet scholars of Religion, so the conversation is fascinating.
He explains that his sect rejects Paul's letters of 1,2,3 John and Revelation based on the perception that they are too negative to be part of the Bible Canon.
I counter with the very positive aspects of the writings (the hope of the future) and he admits the appeal.
In the end we part amicably.
I meet several Muslims and others who are just happy I am happy to be in Portugal.
A successful morning. Preaching isn't only about helping others, it's about practicing and sharpening our following of Jesus example.
We stop for coffee and to get warm. Our friends don't like the coffee spot and my wife doesn't want to walk down to the water front. So, we hop in the car and dash home for a light lunch of vegetarian nachos.
Now, nothing against my friends or vegetarians in general: but nachos without meat: :–( They aren't terrible, but just call them nachos. The vegetarian moniker takes something away. Or maybe it was the lintels he added for protein.
Left me wanting a steak. A big fat salmon steak. Mmmmmm.
After lunch, it was time to explore and I made my way down to to the beach to knock on the door of the universe.
Walking on the beach, I learned my free orange wasn’t the win I thought it was. Peeling it, I noticed it had no smell, seeing it i realized it was dry and tasteless. I will learn later that you have to pick the oranges in season. can tell by the attached leaves.
C’est la vie.
So the birds got a free orange.
Isn’t every orange a bird eats a free orange?
I’ve never seen a sparrow with a debit card or a raven discussing exchange rates.
The early afternoon was filled with wandering and wondering. When the beach's winter novelty wore thing, I jumped a train back into Porto so I could drift through the cobblestone alleys and streets and think about the ancient structures in this city. What humble hands hewed that stone, and later stacked it against the centuries?
Did those hand-men think about how they would bear children, who would bear children, who would bear children—until finally, one day, some moon-faced white man would wonder about them even though they were long dead? How surprised they will be in the resurrection to learn of the history that happened to their city after they handed it to the next generations.
A walk on the beach, exploration of ruins, and some playing catch-up on managing notes and journals. I finish the afternoon back at the beach in a cafe with a very tall beer while I watched the surf pound the shore.
If the sea was sentient, I would surely think it had caught the beach with a lover—for hell hath no fury like the sea scorned, and it is relentless in it's assault on that sandy rocky stripe between terra and posiden's realm.
Client work called at 5:30, and I dutifully held on until it was time to leave for my meeting for worship at 7:30. I am used to a three minute drive. But here, the commute, with traffic, was nearly an hour!
We had an enjoyable time. Very relaxed and got to make some new friends.
Thursday, December 18, 2025
The next day started late. Working through the night has that effect.
The only thing on the map for the day was a surprise. Our friends booked a tour of a winery where they took about a mile of their old cellars and turned them into an art gallery. Thousands of works of art from Spain, southern Africa and around the world. The owner loved collecting art.
Bonus, they make amazing wine!!
But first, some client mop-up, then a dash out the door for our subterranean museum visit.
I was excited at the museum. And I have to say—I definitely could have stayed there all day.
The art was great, but the wine was irresistible: three glasses of sparkling brut, one rosé, and a fifth of a white, and I was positively ready to party.
We walked a mile and a half through old wine cellars. I found myself oddly drawn to the African art. How strange—and how telling—that their tombstones were ceramic penises for men and breast-like orbs for women. They had no written language, but they understood sex. And when it came to headstones, size definitely mattered. The more important you were, the bigger your representation.
Still, there were far more non-sexual pieces than phalluses. Masks and ebony carvings galore. In fact, the bulk of the collection was from sub-Saharan Africa.
Then there was the geode corridor—thousands of enormous geodes and crystals of every kind.
The tour ended with Portuguese artists, especially ceramicists. Loads of gorgeous, rich ceramics grouped by theme: birds, reptiles, food, flowers. And then these very curious bulls—not huge, about the size of a gallon jug. Shiny ceramic, each with a fill spigot behind the neck and a small twist handle at the shoulder.
The guide explained that you filled them with Aguardente Bagaceira (Portuguese moonshine), and when entertaining—once your guests agreed to imbibe—you’d have them hold a glass beneath the bull and turn the handle, whereupon the moonshine would run out of the bull’s genitals.
A strange, but he assured us, highly entertaining experience—especially after the first glass or two.
The art was fascinating in its diversity and origin. The collector clearly loved the southern African continent.
But the setting was even more captivating: 150-year-old tunnels where millions of bottles of wine had matured and made countless hearts happy—and no doubt broken a few as well.
The tunnels went on and on, dark and wet. There was a smell—sweet and damp. One section was so pungent and musky it made me cough. The sensation was overwhelming, like walking into an Indian kitchen that had vastly overused spices.
It was the same thousand feet as the geode and crystal collection, and I couldn’t tell whether the odor came from the rocks or from a particular wine once stored there.
The dark and the mystery were deeply appealing. I don’t know why I liked it so much. It wasn’t scary or dangerous, not even claustrophobic. The cleanliness, the art, the wine—it was the kind of place you naturally want to spend all day.
I pictured myself as Indiana Jones or Tom Sullivan, searching for a cross of the Knights Templar that would guide me to the next clue—or a missing page of the Hypnerotomachia Poliphili, carved into a stone stela, completing the mystery irrefutably.
The spell broke when, after a few hours, we ascended a winding staircase back to the living world and emerged—of course—through the gift shop.
Not an unpleasant ending. We toasted with glasses of a wonderful brut sparkling wine.
Since we were already south of Porto by an hour, it was an easy argument to convince me to ride up into the mountains to see the King’s Hunting Palace, now converted into an intensely posh hotel.
We arrived at dusk, passing through lovely Portuguese villages tourists rarely—if ever—see. How delightful to have local friends so willing to show us around.
The palace was incredibly ornate. Hardly six inches existed without some kind of decoration, sculpture, or visual interest. And it was huge. It would take a king’s wealth to build a structure like this—complete with a labyrinth garden and an impenetrable forest.
 Barrel room
 Snakes and lizards
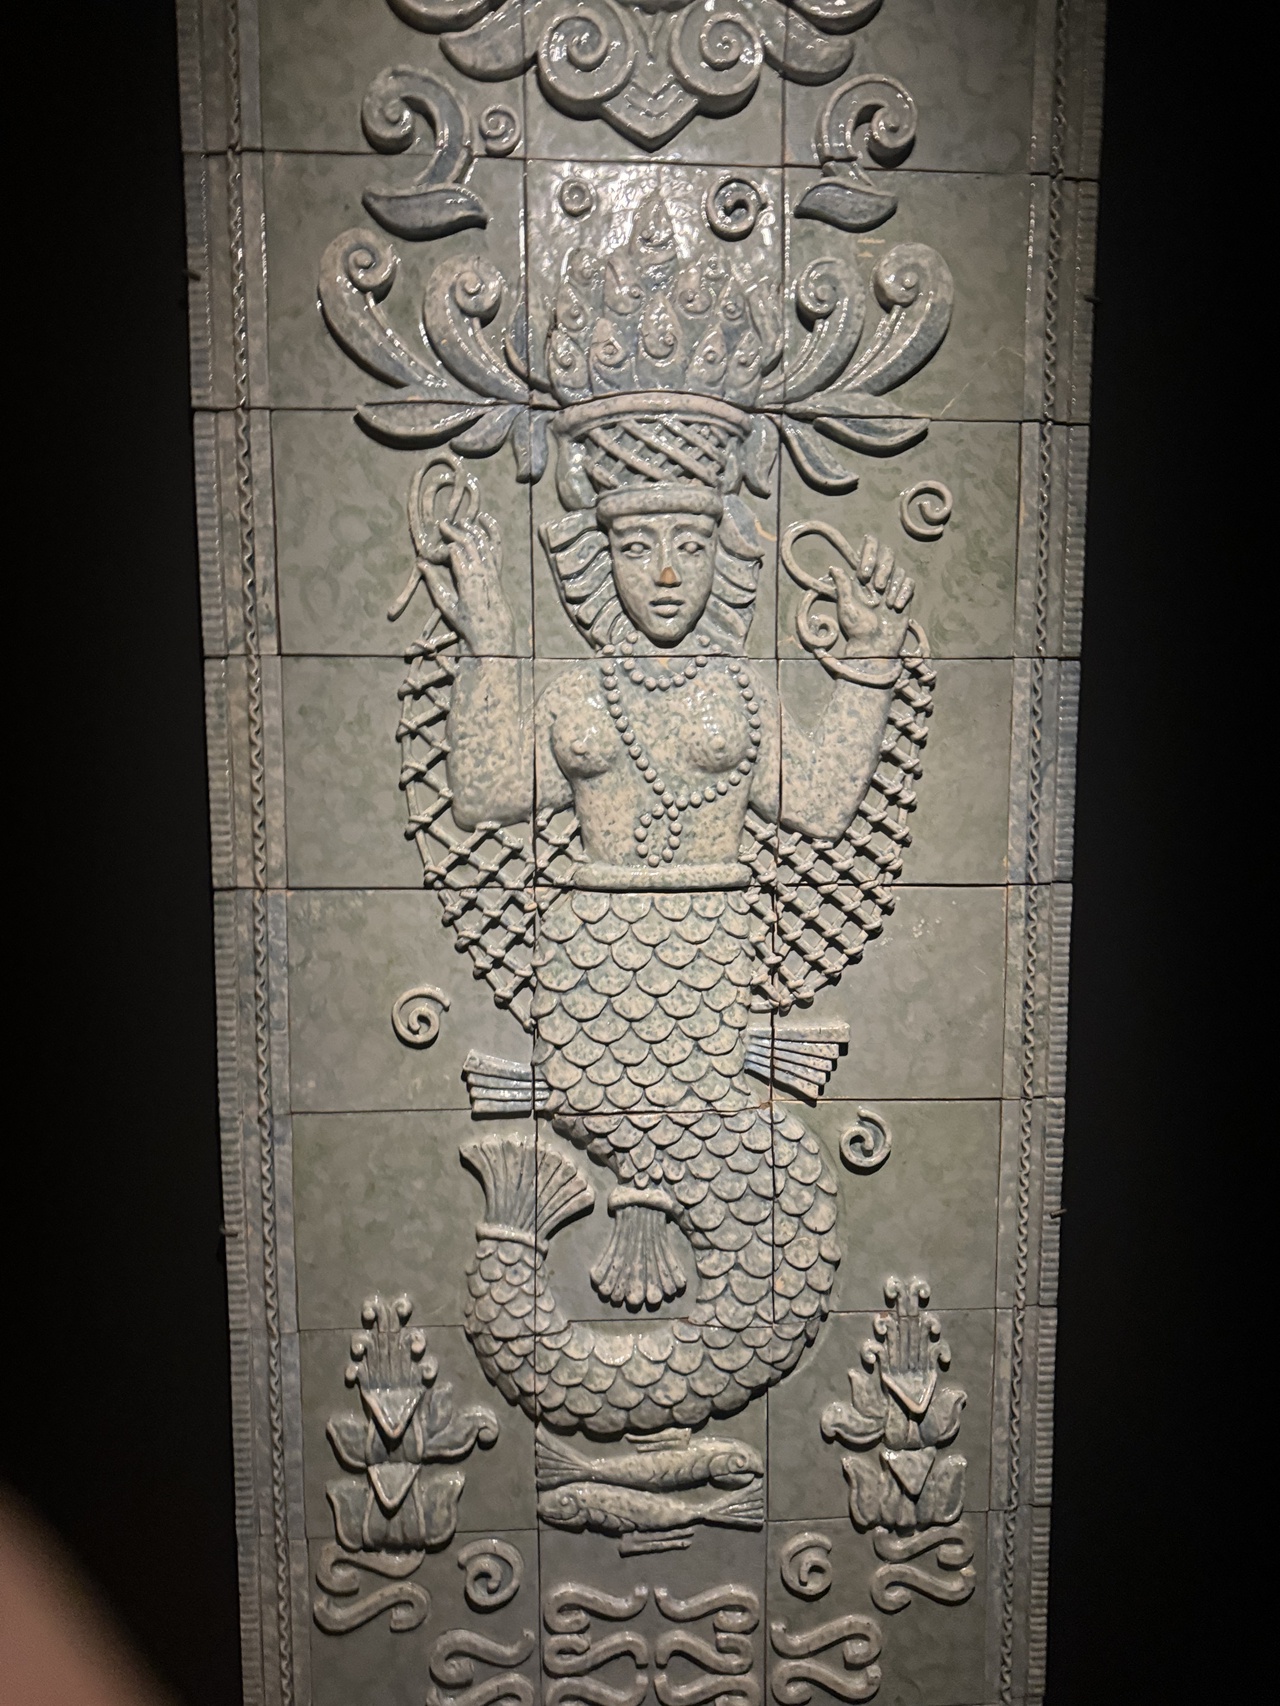 Mermaid
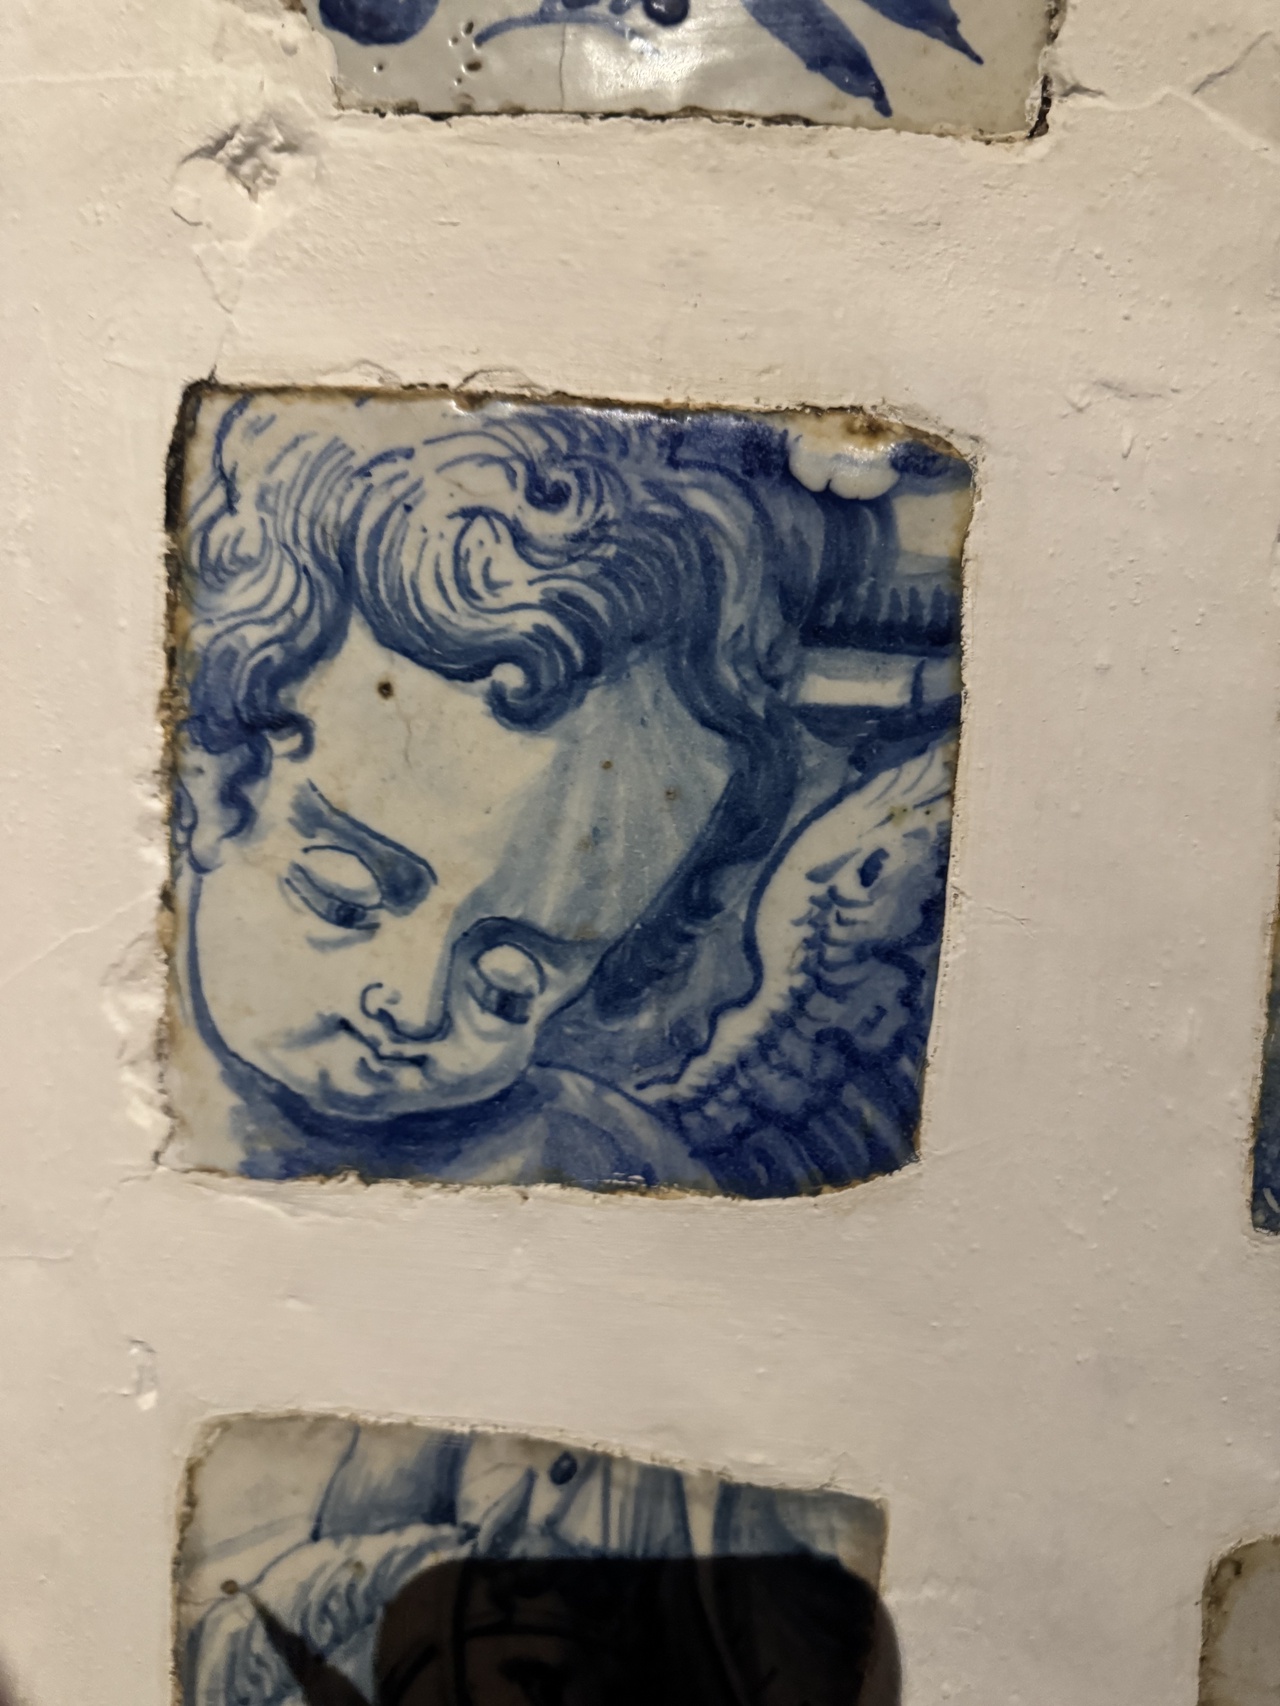 Tile faced
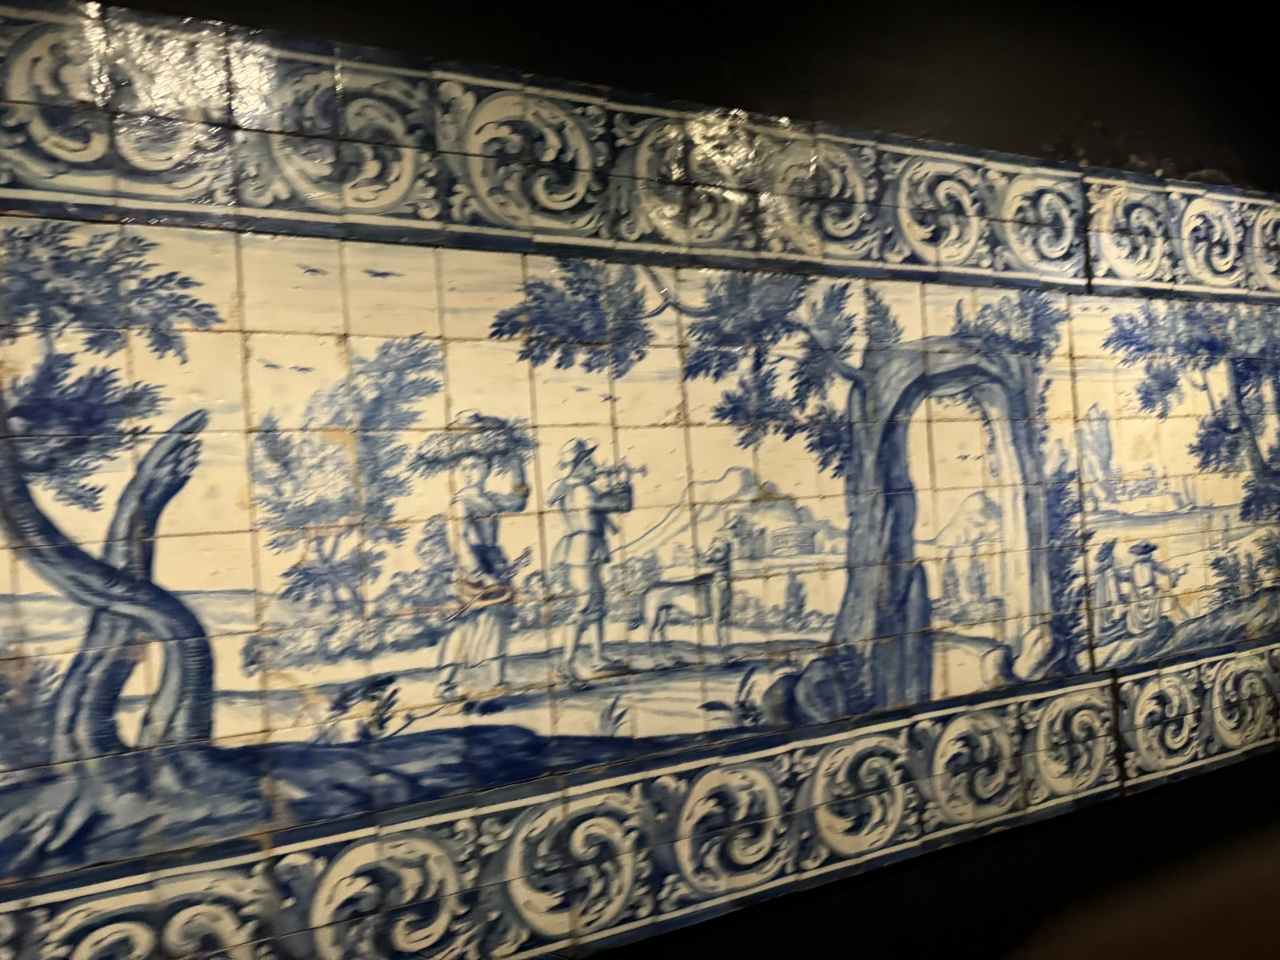 Bucolic scene
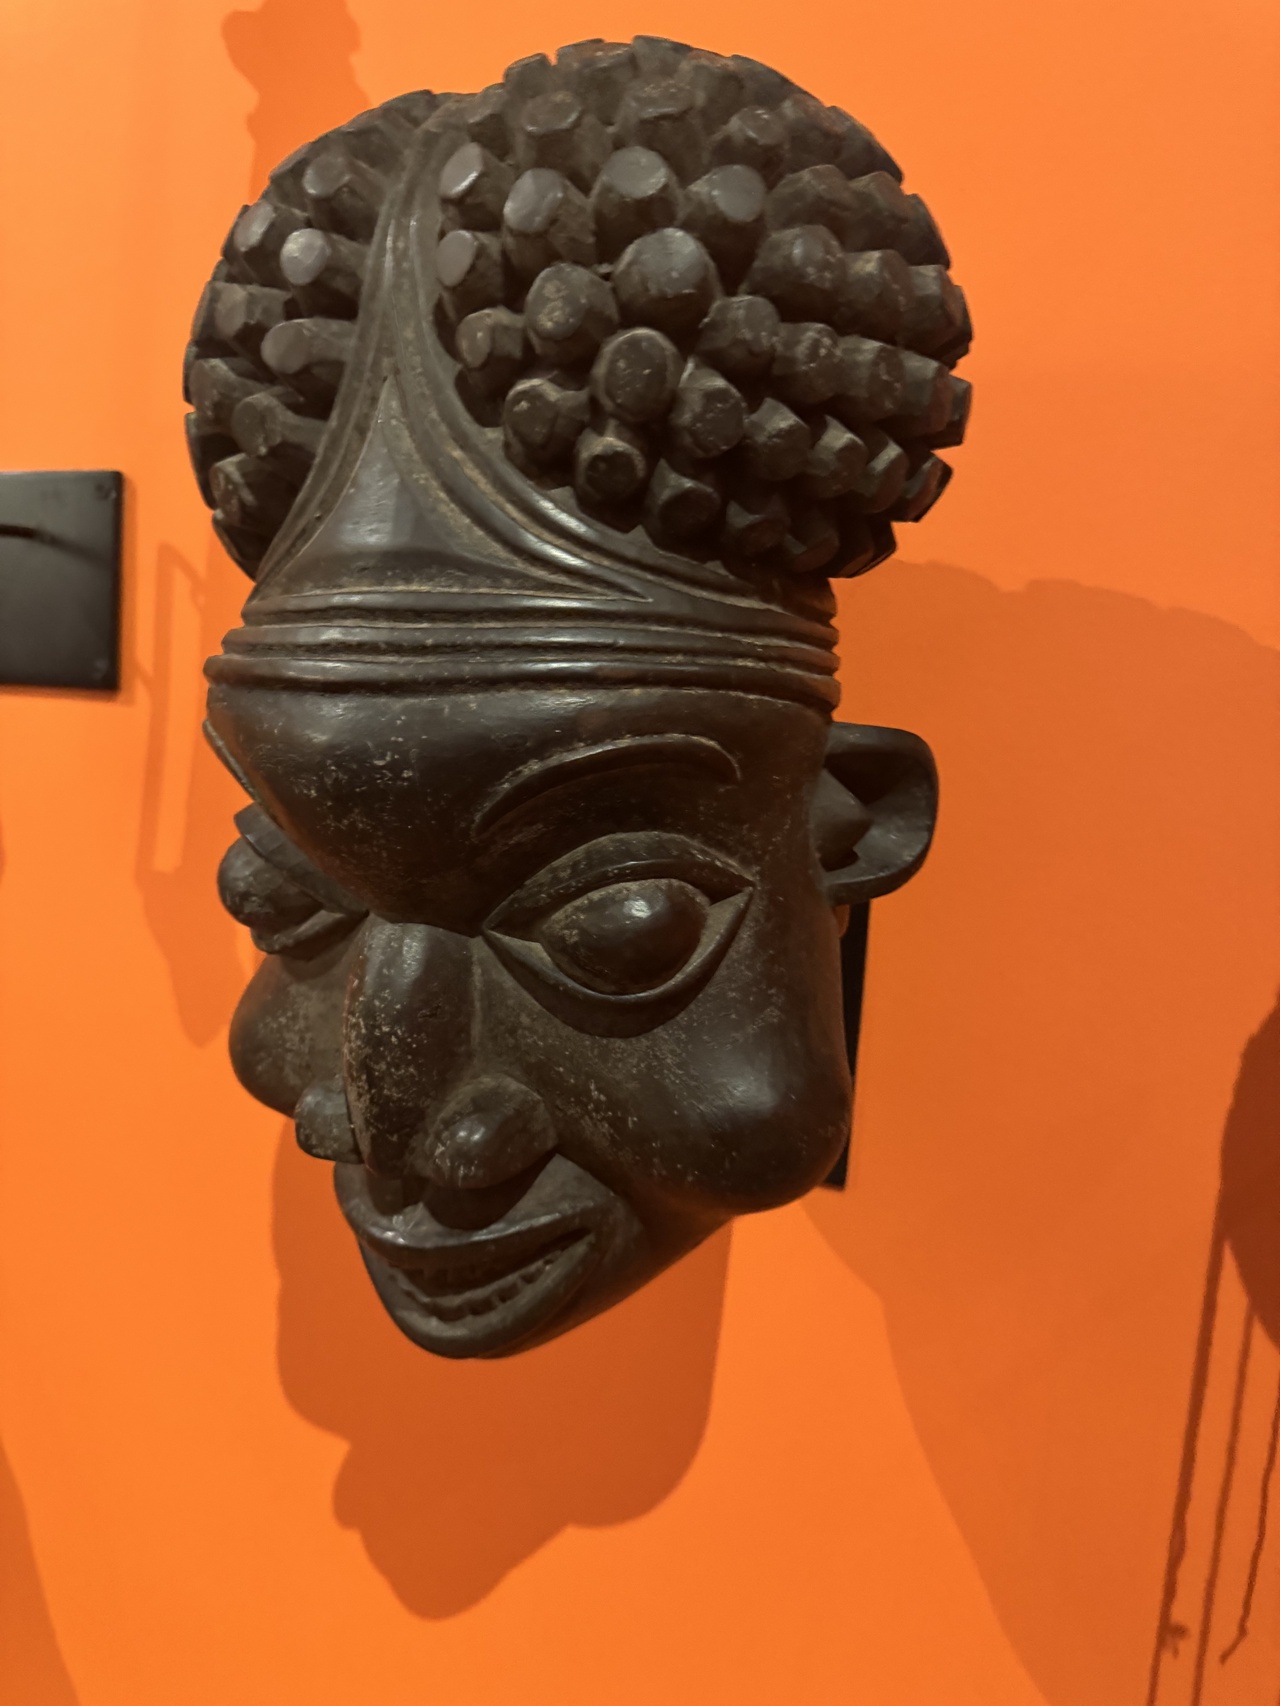 Africa head
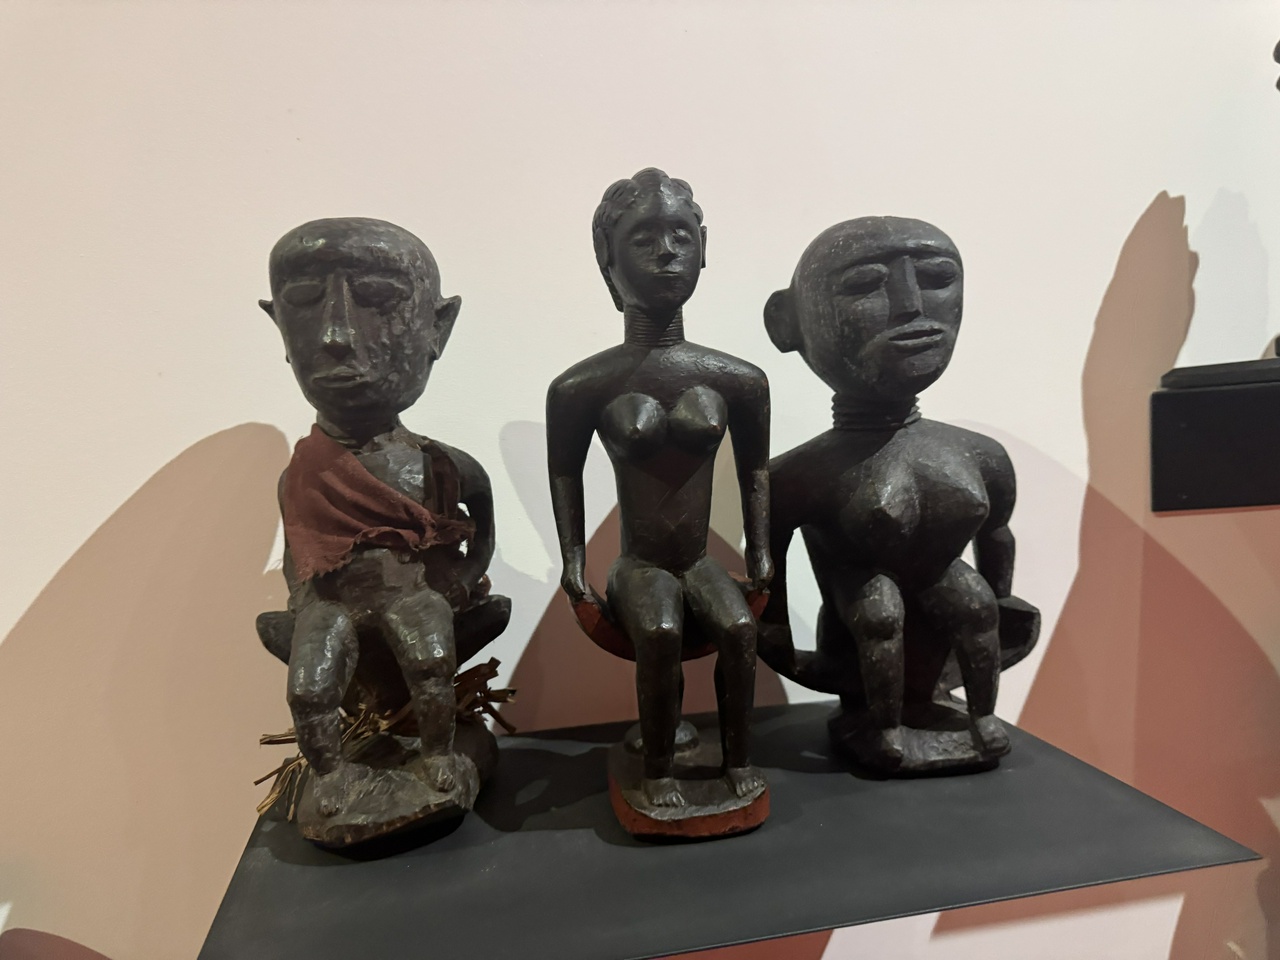 African Chalice
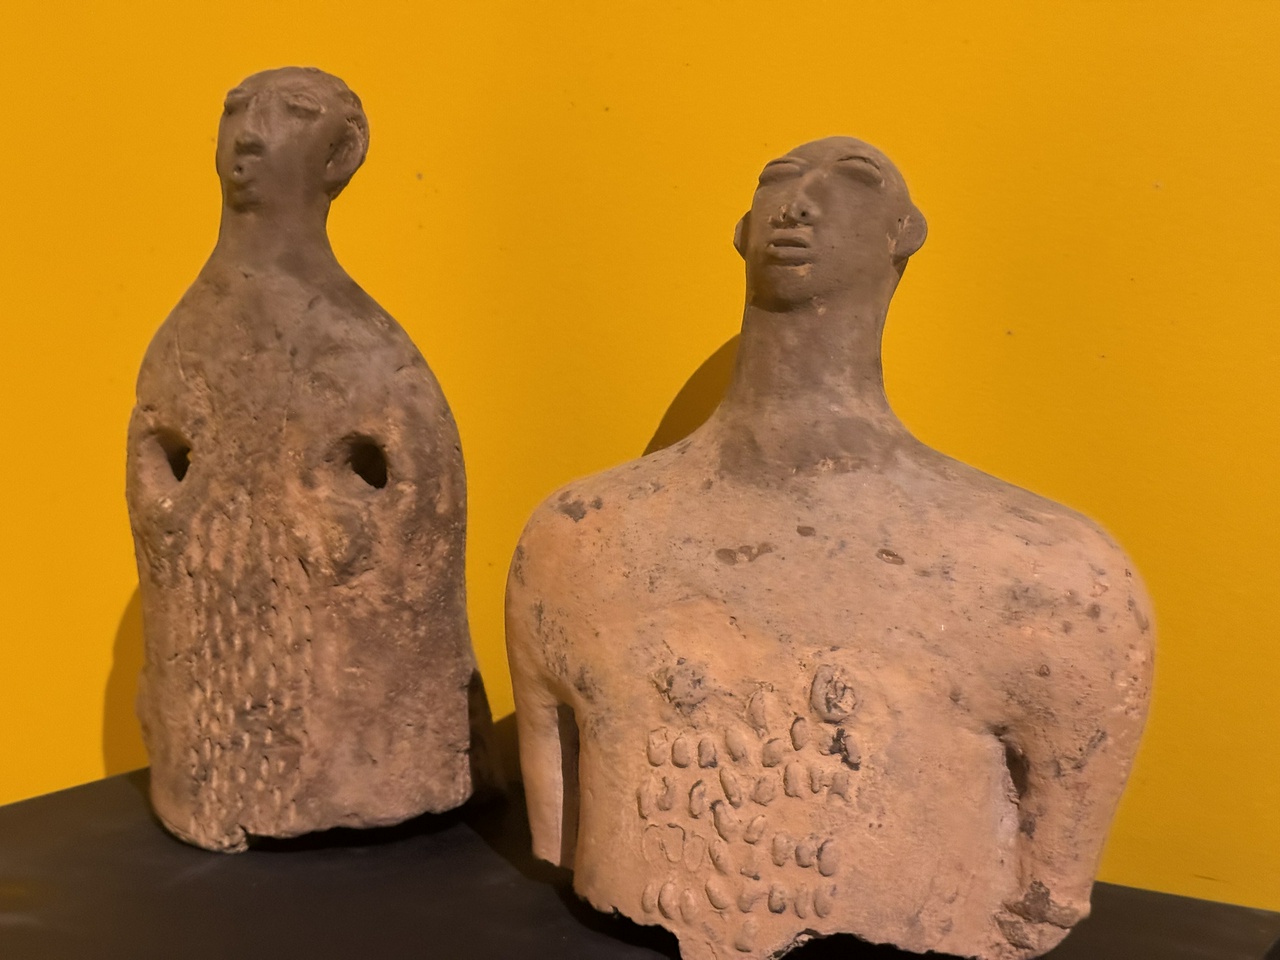 Terracotta heads
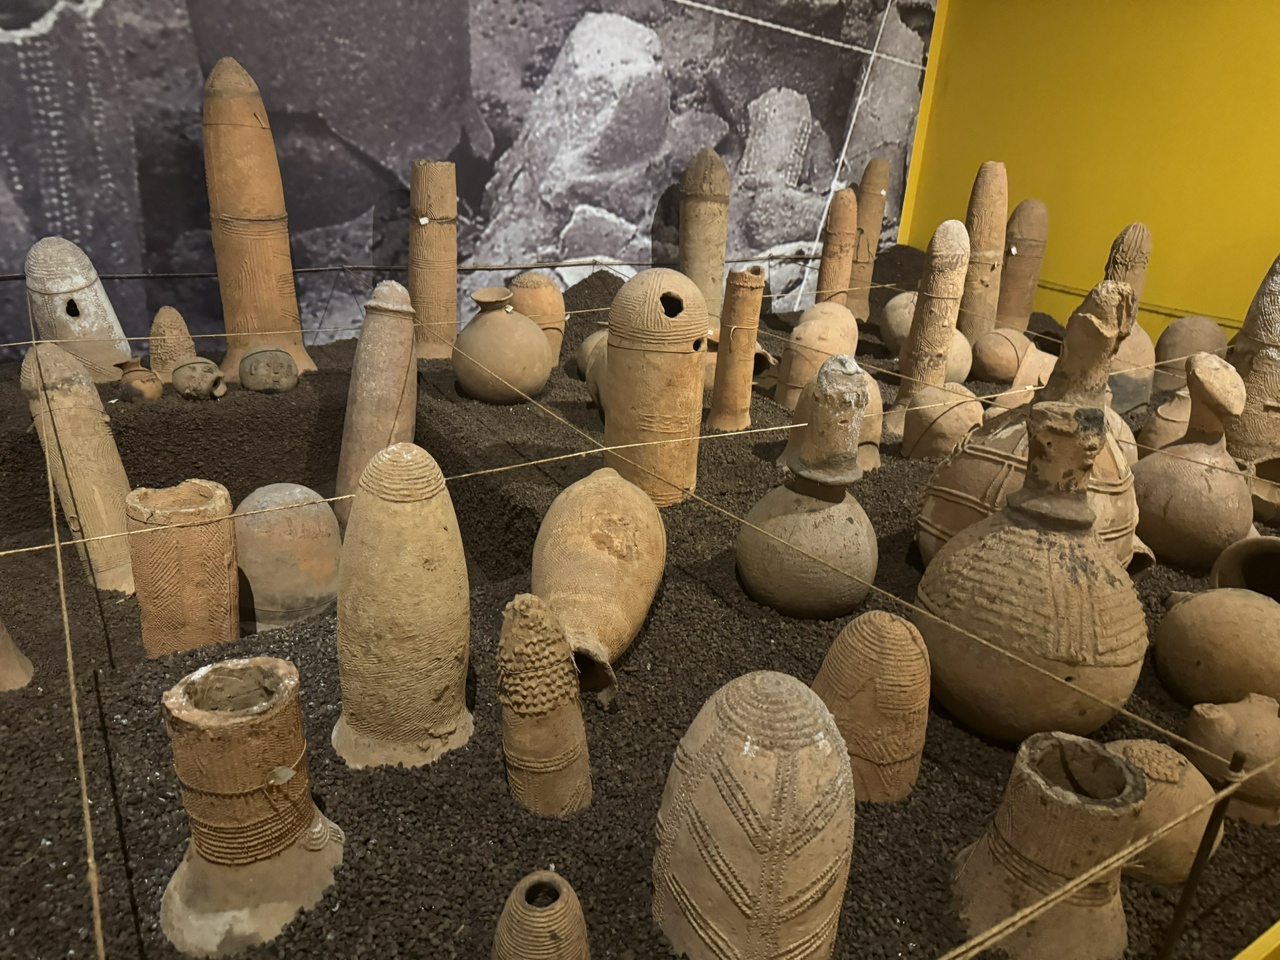 Phallic Cemetery
 Ivory sculpts
 Mc seaside
 My church rock
 Doorknob
 Hummer
IBMD Data Center: Surgical Robot Market 2026.1-2026.5
from  IBMD Data Center
I. Overall Market Phased adjustment against a high base
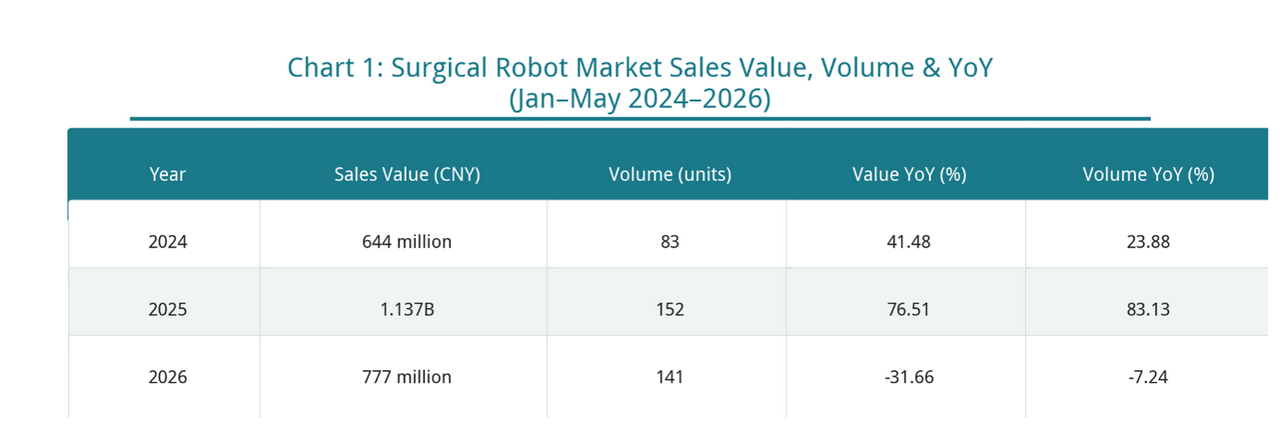
From the overall market performance, China's surgical robot market recorded sales of RMB 777 million and volume of 141 units in the first five months of 2026.
Reviewing data for the same period over the past three years:
From January to May 2024, the market recorded sales of approximately RMB 644 million, up 41.48% YoY, with volume of 83 units, up 23.88% YoY.
In 2025, the market expanded further to RMB 1.137 billion, with volume reaching 152 units. Sales value increased 76.51% YoY and volume increased 83.13% YoY, hitting the highest level for the same period in recent years.
Entering 2026, the market saw a phased pullback. Sales value fell 31.66% YoY and volume fell 7.24% YoY.
On June 3, 2026, the website of the China Securities Regulatory Commission (CSRC) showed that Beijing Surgerii Robotics Company Limited and its sponsor CITIC Securities had submitted the Report on Completion of Tutoring Work to the Beijing Bureau of the CSRC. This marks the completion of Surgeri Robotics' STAR Market IPO tutoring, bringing it one step closer to formally submitting its listing application.
This progress is not an isolated event.
Over the past few years, China's surgical robot industry has completed the first round of industrialization validation spanning R&D, clinical verification, registration approval, and capital market listing. TINAVl Medical Technologies, MicroPort MedBot, and Shenzhen Edge Medical have successively entered the public capital markets; Edge Medical's STAR Market IPO passed review in 2023; Shanghai Simple Touch Robot has also submitted a listing application to the Hong Kong Stock Exchange, reflecting continued capital-market activity among percutaneous intervention robotics companies.
The fact that a growing number of enterprises are entering the IPO stage signals a shift in industry competition.
The focus of capital market attention is no longer whether an enterprise owns a robotic product, but whether the product can achieve scaled installation, sustained clinical application, and stable commercialization revenue. In other words, China's surgical robot industry is gradually transitioning from the “technology validation phase” to the “commercialization validation phase.”
Market data has thus become the most direct window through which to observe this transformation.
It is worth noting that the decline in volume was significantly smaller than the decline in sales value.
This phenomenon indicates that the current market is not experiencing rapid demand contraction, but rather that the product mix is undergoing changes. As Chinese products continue to scale up and more mid-to-low-priced products enter the market, the proportion of high-priced models has declined, driving the industry's overall transaction prices to gradually return to rational levels.
From the perspective of industry development patterns, this is typically an important characteristic of the market transitioning from the demonstration-and-application stage to the scaled-popularization stage.
II. Segment Breakdown
Orthopedic and Laparoscopic Robots as Dual Core Driver
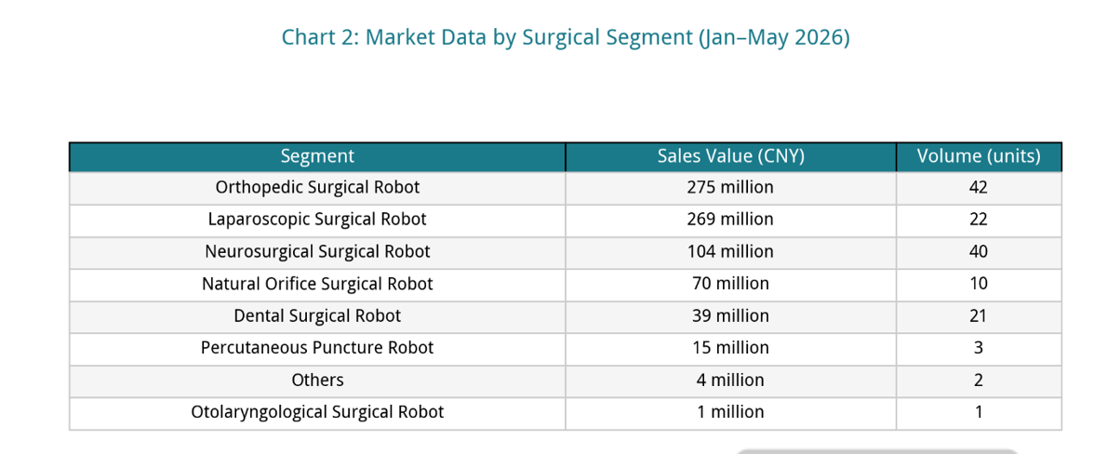
From the perspective of segment structure, orthopedic surgical robots and laparoscopic surgical robots remain the two largest categories by market size.
Among them: Orthopedic surgical robots achieved sales of RMB 275 million and volume of 42 units; laparoscopic surgical robots achieved sales of RMB 269 million and volume of 22 units. The two major tracks together contributed approximately RMB 544 million in sales value, accounting for nearly 70% of the overall market, and remain the core pillars of industry development.
Unlike laparoscopic robots, which are subject to large medical equipment configuration license regulations, orthopedic robots do not require such a license. With a relatively lower procurement threshold, they hold certain advantages in installation and promotion.
From the perspective of volume, neurosurgical robots have gradually formed a trend of scaled procurement, reflecting the continuously increasing acceptance of brain surgery navigation and robot-assisted positioning technology in clinical applications.
In addition, natural orifice robots achieved sales of nearly RMB 70 million and volume of 10 units; dental robots achieved sales of RMB 39 million and volume of 21 units; percutaneous puncture robots achieved sales of RMB 15 million and volume of 3 units.
Overall, China's surgical robot market is gradually breaking away from the past pattern of “laparoscopic robots standing alone,” entering a new stage of coordinated development across multiple specialties including orthopedics, neurosurgery, dentistry, and natural orifice surgery.
III. Brand Competitive Landscape
International Leaders Retain Advantages; Domestic Enterprises Accelerate Catch-up
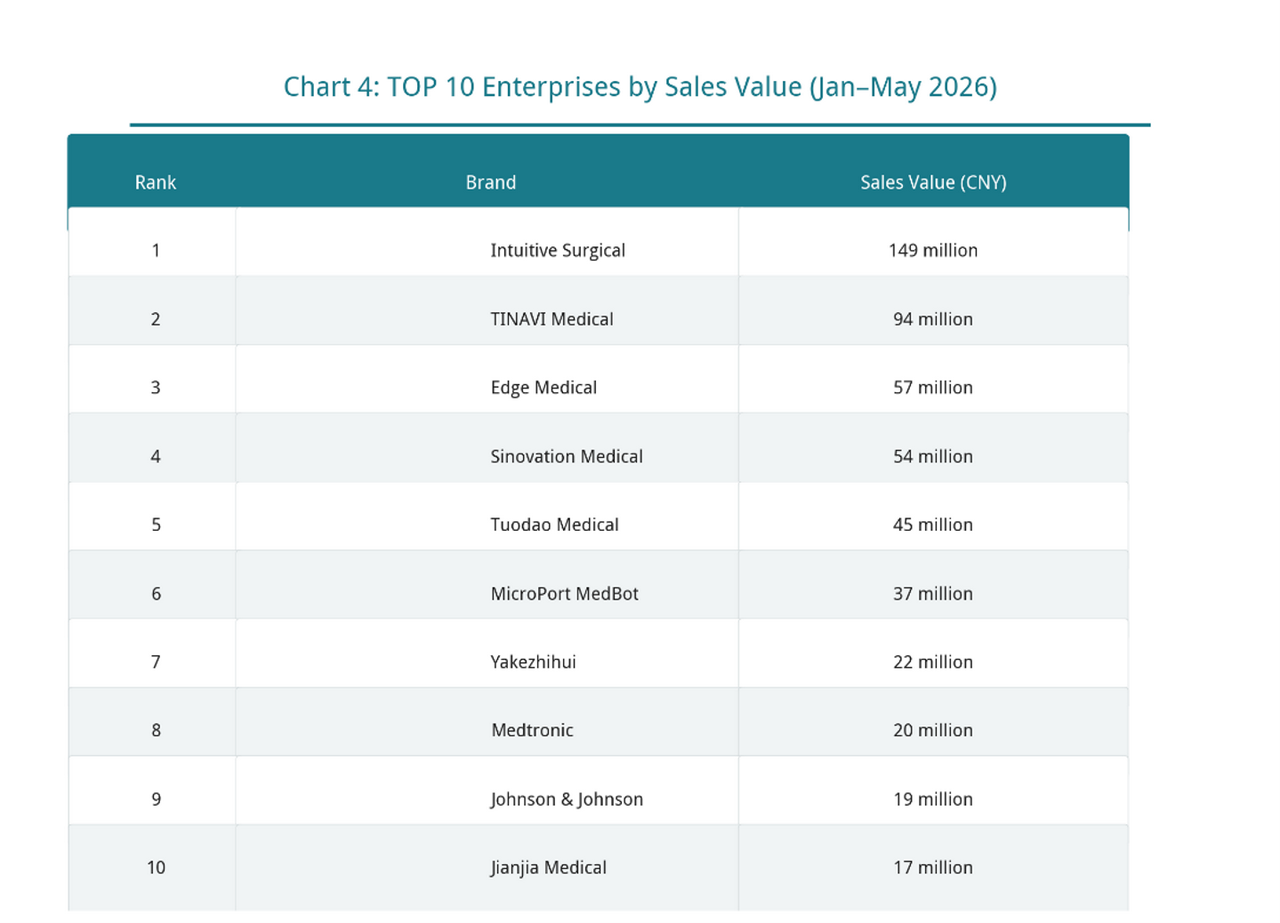
From the perspective of sales value ranking, international leading enterprises still maintain their leading advantage.
In the first five months of 2026, Intuitive Surgical ranked first in the market with sales of RMB 149 million, occupying an industry-leading position. As the owner of the da Vinci surgical robot, Intuitive Surgical retains strong market influence by virtue of its mature product system and long-accumulated clinical foundation.
Among Chinese enterprises, TINAVI Medical Technologies ranked second with RMB 94 million in sales. SenseRobot, Huake Precision, Tuodao Medical, MicroPort MedBot and other Chinese brands followed closely behind, together forming the first echelon of Chinese robots.
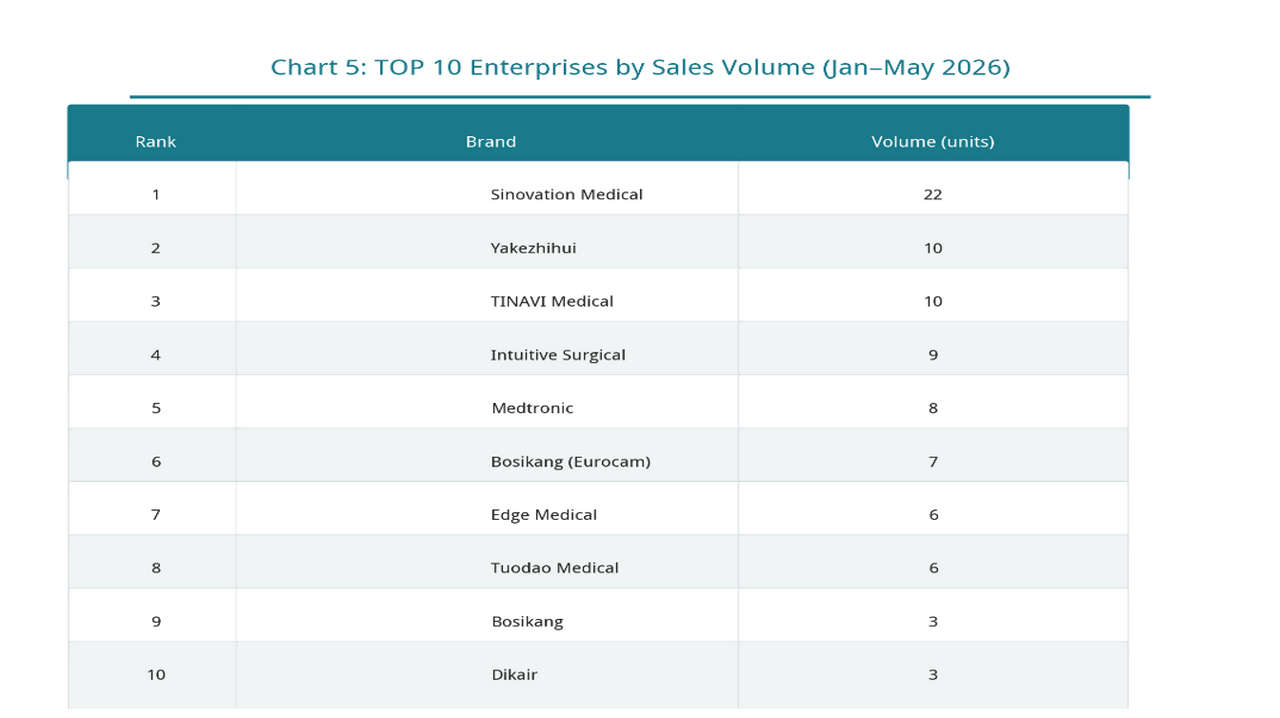
Observing from the perspective of sales volume, the market pattern presents different characteristics. Huake Precision ranked first in the industry with 22 units; Yake Smart and TINAVI Medical Technologies both achieved sales of 10 units; Intuitive Surgical and Medtronic sold 9 and 8 units respectively.
From the above analysis, it can be found that leading sales value does not completely equate to leading sales volume.
Some high-end robots occupy the sales value advantage by virtue of their higher unit prices, while specialty robots such as neurosurgical and dental robots achieve market penetration through higher installation volumes. Industry competition is gradually shifting from product R&D competition to commercialization capability competition.
Whoever can enter more hospitals, cover more departments, and achieve sustained clinical application will become the core of future market competition.
IV. Procurement Entities Grade 3 Class A Hospitals Remain the Market Core
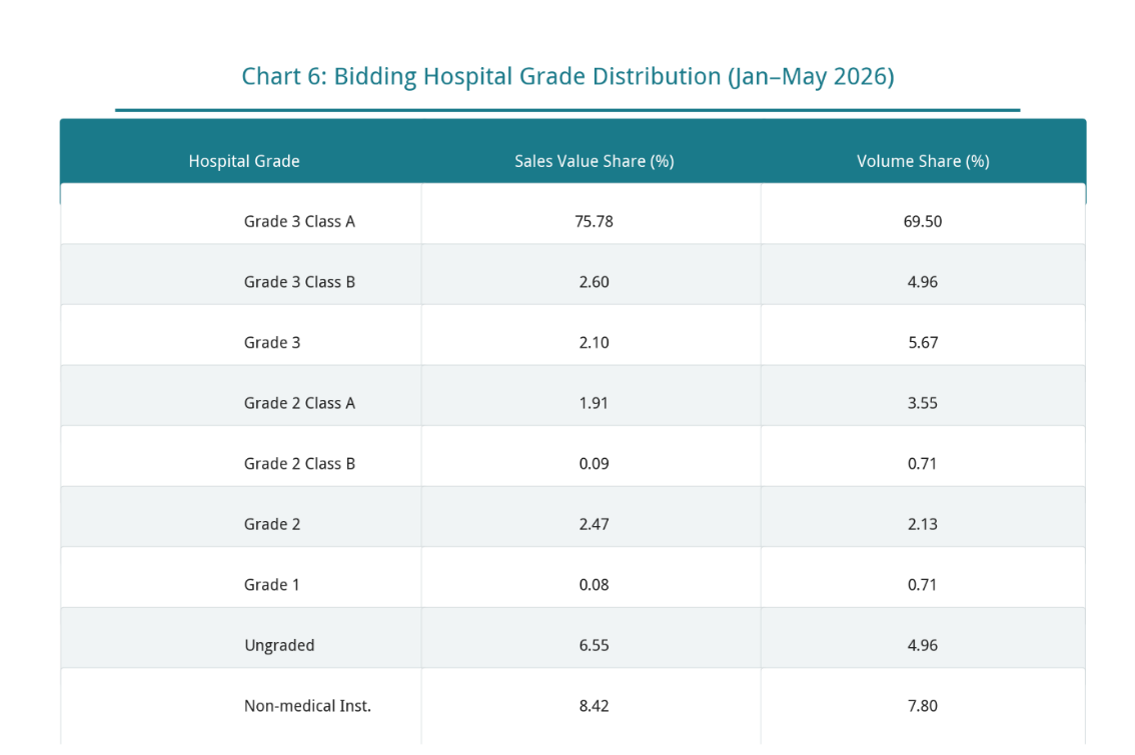
From the perspective of procurement entity structure, Grade 3 Class A hospitals remain the most important procurement force in the current surgical robot market. Data shows that Grade 3 Class A hospitals contributed 75.78% of market sales value and accounted for 69.50% of total volume. Whether from the perspective of procurement amount or procurement quantity, Grade 3 Class A hospitals still constitute the fundamental base of the market.
Non-medical institutions accounted for 8.42% of market sales value, ranking second, reflecting that research institutions, teaching platforms, and related experimental centers remain an important component of robot procurement. Grade 3 Class B hospitals, other Grade 3 hospitals, and Grade 2 medical institutions together contributed approximately 9% of market sales value. Although their share is still low, they have begun to form sustained procurement demand.
Overall, the current surgical robot market remains highly dependent on top-tier hospitals. However, as product prices gradually decline and the medical insurance payment system continues to improve, the downstream market is expected to become an important incremental source for the future.
Conclusion
2026 marks an important turning point for the surgical robot industry.
If the core task of China's surgical robot industry over the past decade was to complete technological breakthroughs and obtain product approvals, then the current industry is entering a new stage of commercialization capability validation.
From the perspective of market data, although the surgical robot market experienced a phased adjustment in the first five months of 2026, the underlying logic of industry development has not changed.
On one hand, orthopedic and laparoscopic robots still constitute the main body of the market; on the other hand, segments such as neurosurgery, dentistry, and natural orifice surgery are gradually opening up market space, and the industrial pattern of multi-specialty coordinated development has initially taken shape.
For enterprises, the key to future competition is no longer just the number of registration certificates and technical parameters, but rather hospital installation capability, clinical promotion capability, and commercial operation capability.
At the same time, the number of approved products continues to increase, the supply capacity of domestic enterprises continues to grow, and market competition is gradually shifting from “whether one has a product” to “who can achieve scaled application”.
For hospitals, as the medical insurance payment system gradually improves and the product pricing system continuously optimizes, surgical robots are gradually penetrating from being an innovative configuration of a few large medical centers toward more specialties and medical institutions.
And for the capital market, the fact that a growing number of surgical robot enterprises are entering the IPO stage essentially reflects that the industry has walked through the technology-validation cycle and is beginning to enter the commercial-value realization cycle.
What will determine enterprise value in the future may no longer be how many innovative technologies one possesses, but rather who can truly transform technology into clinical value, and ultimately form sustainable market demand.
From this perspective, 2026 may not be the year of fastest growth for China's surgical robot market, but it is likely to become an important watershed for the industry's transition from technology-driven to commercialization-driven development.
Asset
from An Open Letter
Unfortunately, I won Catan today. I say unfortunately, because there were a few people I was playing with that were being somewhat competitive and were a little bit of a sore loser at the end. I understand that this is not my responsibility, but at the same time I recognize that some people are sore losers and I am completely fine losing games. My biggest priority is that everyone is having fun, and the way I see it is if I win someone else may be unhappy if someone else wins I won’t be unhappy at that, and they will likely be more happy and so I don’t mind. But unfortunately, that’s just how the game went and I guess I could have thrown more than just sharing information or strategy against myself, but at the same time I feel like that’s kind of excessive. It’s not like it’s my responsibility to make sure that the other people will not be sore. Losers, that is on them. Do it right there?
EpicMonday 31: Warum wir mehr Ablehnung riskieren sollten
from  EpicMind

Freundinnen & Freunde der Weisheit! Die Angst vor Zurückweisung hält viele Menschen davon ab, ihre Ziele zu verfolgen. Doch eine neue Herangehensweise zeigt: Wer bewusst nach Ablehnung sucht, kann nicht nur Resilienz aufbauen, sondern auch überraschend oft ein „Ja“ erhalten.
Die Journalistin Jillian Anthony testete dies mit ihrem Projekt „November of NO“, in dem sie gezielt Ablehnungserfahrungen sammelte – sei es bei Jobbewerbungen, journalistischen Pitches oder anderen Herausforderungen. Statt sich vor dem Nein zu fürchten, machte sie es zum Ziel. Das Ergebnis: Sie erhielt zwar einige Absagen, aber auch neue berufliche Chancen.
Psychologische Forschung zeigt, dass eine hohe Angst vor Zurückweisung mit geringem Selbstwertgefühl, Vermeidungsverhalten und erhöhtem Risiko für Angststörungen verbunden sein kann. Doch wer Ablehnung als normalen Bestandteil des Lebens betrachtet, gewinnt nicht nur mehr Selbstvertrauen, sondern erhöht langfristig seine Erfolgschancen. Experten empfehlen, konkrete „Ablehnungsziele“ zu setzen, zum Beispiel eine bestimmte Anzahl von Bewerbungen oder Anfragen pro Woche. Durch diese Methode kann sich die Wahrnehmung von Ablehnung verändern – von einer persönlichen Niederlage hin zu einem notwendigen Schritt auf dem Weg zum Erfolg.
Wichtiger noch: Je öfter wir uns bewusst Ablehnung aussetzen, desto leichter fällt es uns, mit ihr umzugehen. Statt Absagen als endgültige Rückschläge zu sehen, können wir sie als Chancen zur Neuausrichtung betrachten. Letztlich entsteht Selbstbewusstsein nicht durch das Vermeiden von Ablehnung, sondern durch das Lernen aus ihr. Wer sich traut, mehr Risiken einzugehen, wird langfristig nicht nur widerstandsfähiger, sondern auch erfolgreicher.
Denkanstoss zum Wochenbeginn
„Nichts fürchtet der Mensch mehr als die Berührung durch Unbekanntes.“ – Elias Canetti (1905–1994)
ProductivityPorn-Tipp der Woche: Die Umgebung optimieren (Ergonomie beachten)
Ein unbequemer Arbeitsplatz kann Deine Konzentration und Gesundheit beeinträchtigen. Investiere in einen ergonomischen Stuhl, einen höhenverstellbaren Schreibtisch oder andere Hilfsmittel.
Aus dem Archiv: Spielend lernen – was LEGO im Unterricht bewirken kann
Kaum eine Kindheit kommt ohne sie aus: bunte LEGO-Steine, aus denen sich ganze Welten erschaffen lassen. Dass diese Bausteine aber nicht nur in Kinderzimmern Wirkung entfalten, zeigt eine neue Studie der University of Surrey: Bereits sechs Wochen LEGO-gestützter Unterricht führten bei Sechs- bis Siebenjährigen zu signifikanten Verbesserungen in räumlicher Vorstellungskraft und Mathematikleistung.
Vielen Dank, dass Du Dir die Zeit genommen hast, diesen Newsletter zu lesen. Ich hoffe, die Inhalte konnten Dich inspirieren und Dir wertvolle Impulse für Dein (digitales) Leben geben. Bleib neugierig und hinterfrage, was Dir begegnet!
EpicMind – Weisheiten für das digitale Leben „EpicMind“ (kurz für „Epicurean Mindset“) ist mein Blog und Newsletter, der sich den Themen Lernen, Produktivität, Selbstmanagement und Technologie widmet – alles gewürzt mit einer Prise Philosophie.
Disclaimer Teile dieses Texts wurden mit Deepl Write (Korrektorat und Lektorat) überarbeitet. Für die Recherche in den erwähnten Werken/Quellen und in meinen Notizen wurde NotebookLM von Google verwendet. Das Artikel-Bild wurde mit ChatGPT erstellt und anschliessend nachbearbeitet.
Topic #Newsletter
Diepzinnig markeren
from  mistynotes

Een hele tijd geleden zag ik op Mastodon een post naar een site die “markdeep” presenteerde. Sommige linkjes die ik interessant vind, die zet ik onder mijn browser-favorieten in het mapje “lopend”, met de bedoeling om er later naar te kijken. Later, ja. Ik denk dat het alweer een jaar geleden is. Of misschien wel meer. Het komt natuurlijk doordat ik in ¨markdeep” niet echt een gereedschap of toepassing zag die ik zelf kon gebruiken. Toch zijn er mensen, bedrijven en volgens de website zelfs universiteiten die het gebruiken. Markup, markdown, en markdeep. Als je dat iets zegt, zou je verder kunnen lezen. Of html misschien...?
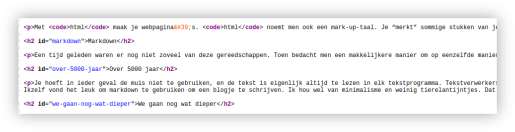
Met html maak je webpagina's. html noemt men ook een mark-up-taal. Je “merkt” sommige stukken van je tekst als speciaal “aan”. Bijvoorbeeld de titel, of een kop, of een subkopje. Dit is handig voor zoekmachines: een kop is wel iets om te tonen als een mens er naar zoekt. Maar het is ook handig voor de browser om de kop iets groter te presenteren op de webpagina dan de paragraaftekst. In html kun je bijvoorbeeld een kop “merken” of “markeren” op deze manier: <h1>Trump chickens out again!</h1>. Dat Trump belangrijk is, daar zal hij het zelf wel mee eens zijn. In dit geval is het niet Trump die belangrijk is maar het stukje tekst, de titel van het artikel. Gelukkig maar. De paragraaf die volgt kun je in de html-mark-up tussen deze twee tags zetten: <p> blabla </p>. Op deze manier kun je ieder stukje tekst een soort van waarde toekennen. En met die waarde kun je ieder stukje tekst op een ander manier laten presenteren. Zo is html dus een “opmaaktaal”. Een voorbeeld van html? Hier is een deel van de html van deze pagina.
Dat ziet er eerlijk gezegd niet echt gezellig uit. Om steeds die <, > en ook die / te typen... Dat is vervelend. Nu zijn er natuurlijk al lang programma's waarmee je op een makkelijke manier webpagina's kunt maken, en die dan zelf html maken. Of je typt een tekst in een tekstverwerker en exporteert het als een html bestand (dan is de extensie van het bestand “.html”). Dat zou toch een prima oplossing zijn. Niet dan?
Markdown
Een tijd geleden bedacht men een makkelijkere manier om op eenzelfde manier de tekst te structureren.  En omdat men grappig wilde zijn (net als ik vaak) noemde men dat markdown. Op de manier van markdown kun je een kop als volgt presenteren:
 # Trump chickens out again!. Alleen maar simpel een hekje ervoor zetten, dus. Er zijn editors en websites die helemaal op markdown ingesteld zijn, en je de tekst presenteren zoals je het op die gestructureerde manier hebt aangegeven. Ikzelf gebruik bijvoorbeeld Apostrophe of het notitieboekje Joplin voor markdown-teksten. En deze website is ook geschreven in markdown, maar door write naar html omgezet. Dus met markdown was ik al bekend. Markdown heeft nog steeds volgelingen, ook al kun je op makkelijke manieren html laten genereren als je een website wil maken. Op deze website worden wat voor- en nadelen van markdown genoemd.
Over 5000 jaar
Je hoeft in ieder geval de muis niet te gebruiken, en de markdown-tekst is eigenlijk altijd te lezen in elk tekstprogramma. Tekstverwerkers zoals MSWord of LibreOffice Writer zetten in het bestand dat je opslaat allerlei rare tekens om bijvoorbeeld aan te geven dat een stukje tekst een kop is. Dat kunnen ook tekens zijn die je niet kunt afdrukken. Dat heeft ook tot gevolg dat andere tekstverwerkers jouw tekst niet goed kunnen tonen, of in ieder geval moeite moeten doen om die goed te tonen. En dan bestaat er dus wel een groot risico, dat jouw tekst door archeologen na 5000 jaar niet meer, of niet meer goed te lezen is. Ja, en eigenlijk schrijven we allemaal natuurlijk voor die archeologen in de toekomst. Ikzelf vond het leuk om markdown te gebruiken om een blogje te schrijven. Ik hou wel van minimalisme en weinig tierelantijntjes. Dat is natuurlijk heel persoonlijk. Ik vind het verder ook prettig om de muis niet te gebruiken in een tekstverwerker, maar gewoon door te kunnen blijven typen. Dus gebruik ik een “editor”.
We gaan nog wat dieper
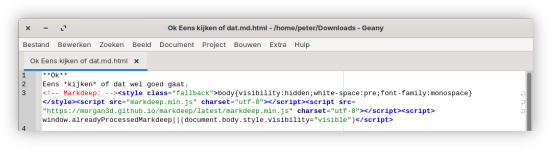
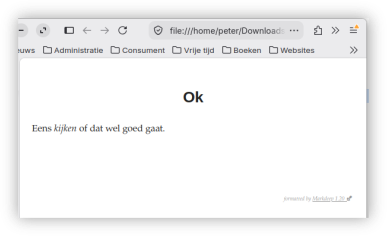
Goed. Maar wat is markdeep dan? Kortgezegd: met markdeep kun je markdown omzetten in markup, html dus. Is dat handig? Ja, als je tekst die je in markdown heb getypt in je browser wil zien. Je kunt dat op verschillende manieren doen. Beginnen met het inladen van een stukje tekst dat ze een template noemen, en dan je eigen tekst typen. Ik heb ervoor gekozen om een regeltje op het einde van mijn markdown-tekst te kopiëren, en dan in plaats van het bestandje op te slaan met de extensie .md (markdown), op te slaan met de extensie md.html. Uiteindelijk is dit dus een html-bestand en zal je browser het bestand openen. Je browser ziet dan vervolgens het script in de laatste regel, en gebruikt dat script om al je geschreven tekst in html om te zetten en te tonen. Heel mooi gedaan! Het werkt ook nog.
wordt
Waarom?
Afgezien van mijn nerd-achtige bewondering van de werking van dit mooie stukje gereedschap, kan ik me niet zo goed bedenken of ik dit nu ooit zou gebruiken. Ik gebruik write.as, en apostrophy. Andere mensen zouden deze programma's ook kunnen gebruiken. Ik kan me alleen voorstellen dat het handig is als je een tekst als markdown presenteert op een server om te tonen, en dat die server bijvoorbeeld automatisch een template verweeft met je tekst, of gewoon die laatste scriptregel vast gaat plakken aan je stuk tekst, voordat de server die aanbiedt op het internet. En dat is in wezen dezelfde werking als ik nu bij write.as ervaar (wel betaald). Maar laat het me weten, wanneer je een toepassing ziet die ik over het hoofd zie.
#website #markdown #html
Jeremiah 22-23
from hypocritepoet

When rulers exploit, shepherds scatter, and prophets lie, Jehovah’s word still burns—and a righteous King will rise.
Jeremiah 22 and 23 condemn Judah’s corrupt kings, shepherds, priests, and false prophets for injustice, exploitation, violence, idolatry, and misleading the people with promises of peace. Jehovah warns that their disobedience will bring devastation, exile, disgrace, and the end of their rule. Yet he also promises hope: he will gather the scattered remnant of his people, provide faithful shepherds, and raise up a righteous king from David’s line who will rule with wisdom, justice, and righteousness, bringing salvation and security.
Chapter 22
This is what Jehovah says: “Go down to the house of the king of Judah, and deliver this message.
You must say, ‘Hear the word of Jehovah, O king of Judah who sits on the throne of David, you with your servants and your people, those who enter through these gates.
This is what Jehovah says:
“Uphold justice and righteousness.
Rescue the one being robbed from the hand of the defrauder.
Do not mistreat any foreign resident, and do not harm any fatherless child or widow.
And do not shed any innocent blood in this place.
For if you are careful to carry out this word, then the kings who sit on the throne of David will enter through the gates of this house, riding in chariots and on horses, they with their servants and their people.”’
“‘But if you will not obey these words, by myself I do swear,’ declares Jehovah, ‘that this house will become a devastated place.’
“For this is what Jehovah says concerning the house of the king of Judah,
‘You are as Gilʹe·ad to me, Like the summit of Lebʹa·non.
But I will make you a wilderness; Not one of your cities will be inhabited.
And I will appoint destroyers against you, Each with his weapons.
They will cut down your choicest cedars And make them fall into the fire.
“‘And many nations will pass by this city and say to one another:
“Why did Jehovah do this to this great city?”
And they will reply:
“Because they abandoned the covenant of Jehovah their God and bowed down to other gods and served them.”’
Do not weep for the dead one, And do not sympathize with him.
Instead, weep profusely for the one going away, For he will return no more to see the land of his birth.
“For this is what Jehovah says concerning Shalʹlum son of Jo·siʹah, the king of Judah who is reigning instead of his father Jo·siʹah and who has gone out of this place:
‘He will return there no more.
For he will die in the place where they have taken him into exile, and he will see this land no more.’
Woe to the one who builds his house without righteousness And his upper rooms without justice,
Who makes his fellow man serve him for nothing, Whose wages he refuses to pay;
The one saying,
‘I will build for myself a roomy house With spacious upper rooms.
I will fit it with windows And panel it with cedar and paint it with vermilion.’
Will you continue reigning because you outdo others in your use of cedar?
Your father also ate and drank, But he upheld justice and righteousness, And it went well with him.
He defended the legal claim of the afflicted one and the poor one, So that it went well.
‘Is that not what it means to know me?’ declares Jehovah.
‘But your eyes and heart are set only on your dishonest gain, On shedding innocent blood, And on committing fraud and extortion.’
“Therefore this is what Jehovah says concerning Je·hoiʹa·kim son of Jo·siʹah, the king of Judah,
‘They will not mourn him:
“Alas, my brother! Alas, my sister!”
They will not mourn him:
“Alas, O master! Alas, his majesty!”
With the burial of a donkey he will be buried, Dragged about and thrown away, Outside the gates of Jerusalem.’
Go up to Lebʹa·non and cry out, Raise your voice in Baʹshan, And cry out from Abʹa·rim,
For all your passionate lovers have been crushed.
I spoke to you when you felt secure.
But you said, ‘I will not obey.’
This has been your course since youth, For you have not obeyed my voice.
A wind will shepherd all your shepherds, And your passionate lovers will go into captivity.
Then you will be put to shame and humiliated because of all your calamity.
O you who dwell in Lebʹa·non, Nestled among the cedars,
How you will groan when pangs come on you, Anguish like that of a woman giving birth!”
“‘As surely as I am alive,’ declares Jehovah, ‘even if Co·niʹah son of Je·hoiʹa·kim, the king of Judah, were the seal ring on my right hand, I would pull you off from there!
I will give you into the hand of those seeking to take your life, into the hand of those whom you fear, into the hand of King Neb·u·chad·nezʹzar of Babylon, and into the hand of the Chal·deʹans.
And I will hurl you and your mother who gave birth to you into another land where you were not born, and there you will die.
And they will never return to the land they yearn for.
Is this man Co·niʹah just a despised, broken pot, A vessel that nobody wants?
Why are he and his descendants hurled down And thrown into a land they do not know?’
O earth, earth, earth, hear the word of Jehovah.
This is what Jehovah says:
‘Write down this man as childless, As a man who will not have any success during his lifetime,
For none of his descendants will succeed In sitting on David’s throne and ruling again in Judah.’”
Chapter 23
“Woe to the shepherds who are destroying and scattering the sheep of my pasture!” declares Jehovah.
Therefore this is what Jehovah the God of Israel says against the shepherds who are shepherding my people:
“You have scattered my sheep; you kept dispersing them, and you have not turned your attention to them.”
“So I will turn my attention to you because of your evil deeds,” declares Jehovah.
“Then I will gather together the remnant of my sheep from all the lands to which I have dispersed them, and I will bring them back to their pasture, and they will be fruitful and become many.
And I will raise up over them shepherds who will really shepherd them.
They will no longer be afraid or be terrified, and none will be missing,” declares Jehovah.
“Look! The days are coming,” declares Jehovah, “when I will raise up to David a righteous sprout.
And a king will reign and show insight and uphold justice and righteousness in the land.
In his days Judah will be saved, and Israel will reside in security.
And this is the name by which he will be called:
Jehovah Is Our Righteousness.”
“However, the days are coming,” declares Jehovah, “when they will no longer say,
‘As surely as Jehovah is alive, who brought the people of Israel out of the land of Egypt!’
but rather,
‘As surely as Jehovah is alive, who brought out and brought back the descendants of the house of Israel from the land of the north and from all the lands to which I had dispersed them,’
and they will dwell in their own land.”
Concerning the prophets:
My heart is broken within me.
All my bones are shaking.
I am like a man who is drunk And like a man overcome by wine,
Because of Jehovah and because of his holy words.
For the land is full of adulterers;
Because of the curse the land has gone into mourning And the pastures of the wilderness have dried up.
Their course is evil, and they abuse their power.
“Both the prophet and the priest are polluted.
Even in my own house I have found their wickedness,” declares Jehovah.
“So their path will become slippery and dark;
They will be pushed and will fall.
For I will bring calamity on them In the year of reckoning,” declares Jehovah.
“And in the prophets of Sa·marʹi·a I have seen what is repulsive.
Their prophecies are incited by Baʹal, And they lead my people Israel astray.
And in the prophets of Jerusalem I have seen horrible things.
They commit adultery and walk in falsehood;
They encourage evildoers, And they do not turn away from their wickedness.
To me they are all like Sodʹom, And her inhabitants are like Go·morʹrah.”
Therefore this is what Jehovah of armies says against the prophets:
“Here I am making them eat wormwood And giving them poisoned water to drink.
For from the prophets of Jerusalem apostasy has spread throughout the land.”
This is what Jehovah of armies says:
“Do not listen to the words of the prophets who are prophesying to you.
They are deluding you.
The vision they speak is from their own heart, Not from the mouth of Jehovah.
They are saying again and again to those who disrespect me,
‘Jehovah has said: “You will enjoy peace.”’
And to everyone who follows his own stubborn heart they say,
‘No calamity will come upon you.’
For who has stood in the inner circle of Jehovah To see and hear his word?
Who has paid attention to his word in order to hear it?
Look! The windstorm of Jehovah will burst out in fury;
Like a whirling tempest it will whirl down on the head of the wicked.
The anger of Jehovah will not turn back Until he has carried out and accomplished the intentions of his heart.
In the final part of the days you will clearly understand this.
I did not send the prophets, yet they ran.
I did not speak to them, yet they prophesied.
But if they had stood in my inner circle, They would have made my people hear my words
And would have caused them to turn back from their bad way and their evil deeds.”
“Am I only a God nearby,” declares Jehovah, “and not a God also from far away?”
“Can any man hide in a concealed place where I cannot see him?” declares Jehovah.
“Do I not fill the heavens and the earth?” declares Jehovah.
“I have heard the prophets who are prophesying lies in my name say,
‘I had a dream! I had a dream!’
How long will this continue in the heart of the prophets, to prophesy lies?
They are prophets of the deceit of their own heart.
They intend to make my people forget my name by the dreams they relate to one another, just as their fathers forgot my name because of Baʹal.
Let the prophet who has a dream relate the dream, but the one who has my word should speak my word truthfully.”
“What does the straw have in common with the grain?” declares Jehovah.
“Is not my word just like a fire,” declares Jehovah, “and like a forge hammer that smashes the crag?”
“So here I am against the prophets,” declares Jehovah, “who steal my words from one another.”
“Here I am against the prophets,” declares Jehovah, “those who use their tongue to say, ‘He declares!’”
“Here I am against the prophets of lying dreams,” declares Jehovah, “who relate them and lead my people astray because of their lies and their boasting.”
“But I did not send them or command them.
So they will not benefit this people at all,” declares Jehovah.
“And when this people or a prophet or a priest asks you,
‘What is the burden of Jehovah?’
you should reply to them,
‘“You people are the burden! And I will cast you off,” declares Jehovah.’
As for the prophet or the priest or the people who say,
‘This is the burden of Jehovah!’
I will turn my attention on that man and on his household.
This is what each of you is saying to his fellow and to his brother,
‘What has Jehovah answered? And what has Jehovah spoken?’
But the burden of Jehovah you should mention no more, for the burden is each one’s own word, and you have changed the words of the living God, Jehovah of armies, our God.
“This is what you will say to the prophet,
‘What answer has Jehovah given you? And what has Jehovah spoken?
And if you keep saying, “The burden of Jehovah!” this is what Jehovah says:
“Because of your saying, ‘This word is the burden of Jehovah,’ after I told you, ‘You must not say: “The burden of Jehovah!”’
look! I will lift you up and throw you away from my presence, both you and the city that I gave to you and your forefathers.
And I will bring on you everlasting disgrace and everlasting humiliation, which will not be forgotten.”’” ```
#biblereading #jeremiah
from untidy creatures.
Another job application done. Another opportunity, of sorts. Another entry in the GTFOH lottery.
A slow step in the right direction. A direction that points due south. Very south.
Since I'm not allowed to watch a nice art house film as a reward (parrot law) I shall continue reading the novel I downloaded last night through my local library app.
The Happiness in Nothing Special
from AnOublietteofThought
Tonight's play... Nothing special. Blobs of chance prancing in shadow. An interrupted contemplation interpreting the figment of release. The long-awaited exhale tingling to expand. Brecciated completeness. A digital mop. Droplets missing from a dried out palette.
Why do I enjoy the freedom of this so much? I would be annoyed in any other media at any other time, but there is pleasure in this. I think it might be because I'm making a mess that I don't need to clean up. I'm really not sure. It's just there, and it can be deleted with the touch of a button and zero guilt.
I talk a big talk about downsizing my studio, but fuck that's hard to do. Everything has potential, and I grate at knowing I'll likely just go and repurchase down the line. I need a mental adjustment.
I know why I'm not investing in making what I want to. It's nothing to share here. It will definitely pass in a positive direction, but I do feel that need to wait. Like the moment just isn't right. I do want to finish the one project, but realistically there's no place for it, and there will be even less of a place for it in the future. I need to come to terms with size. Maybe I just need to come to terms with me...
I got a pink dress today. Pink! A beautiful high/low number with what I call peek-a-boo sleeves. It was available in black. I've worn two colors 99% of the time for the last eight years or so. One of them being black. My closet used to have much more variation than it currently has.
I'm not sure what I feel about the pink. I think those colors represent my softer, more vulnerable side. Am I allowing that out to play again? I'm not sure. I think I might be. I'm really not sure if the pink still exists within. I imagine it could. It currently feels a bit unsettling. I may have moved on from it, but I do know I gravitate towards the pink dress instead of the black. It surprised me. It's something I need to consider.
I am grateful for the opportunity to fumble my way back towards a more complete me. Life often escorts us into roles that we didn't choose, or maybe we did choose them but weren't aware of what that choice would mean. We release little pieces of ourselves, outgrow others, and even have some stolen.
My birthday is in a few months. I don't know why I continue to be surprised by my age. I probably always will be. I feel a major shift continuing to happen. Not just in the world—in myself. Maybe that's why I'm finding such joy in just throwing color on a digital page.
Written August 2, 2026. © 2026 AnOublietteofThought.

What Makes a Story Cozy?
from Nerd for Hire
Cozy fiction is having a moment in the speculative world. It started with cozy fantasy, which has been growing in popularity for the last few years, but has now spread into the adjacent genres of sci-fi and even horror, and the publishers looking for cozy fiction have been popping up like toadstools since 2020.
For some context, the term “cozy” is borrowed from cozy mysteries. While the style the term describes has its roots in the 1920s, the term wasn't coined until the 1980s. It describes a mystery that focuses on solving a crime rather than the dark, gritty details. There are other typical tropes of the genre, like that they often have an amateur detective as the protagonist and typically take place in an isolated or secluded location, but the pertinent detail that earned the nickname “cozy” is that the stakes and the violence and both relatively low. The initial crime can be a murder, but it usually happens off-screen and to someone that neither the reader nor the protagonist care about too deeply.
This is the spirit that the term “cozy” represents when it's ported over to other genres. In a sense, it's become like the ”-punk” suffix, carrying implications of a specific tone that can be mixed and matched with other terms to create new subgenres. And, just like with -punk, different people seem to have different interpretations of exactly what it means. In the case of cozy, its use outside the mystery genre is relatively new, which adds to the confusion. But it's becoming enough of an established trend that the borders of the genre, and just what editors are looking for when they put out calls for it, are becoming more defined.
The rise of cozy fantasy
Cozy mystery's rise in popularity in the '80s was a reaction to the trend toward more realistic and violent fiction in mystery and crime writing during the '60s and '70s. Readers who enjoyed the stories of writers like Agatha Christie were eager for a return to stories that invited readers to solve puzzles rather than focusing on the grim details of the crime itself or its broader emotional implications.
The rise of cozy fantasy had more to do with readers' emotional states than their literary tastes. It started to gain prominence in the 2020, in the heart of the pandemic, when the world was on fire in more ways than one and many people were operating at a baseline level of stress and anxiety well above their norm. Readers didn't want to deal with heavy shit in stories. They wanted to escape to somewhere pleasant and peaceful, and cozy fantasy stories perfectly fit the bill.
As is the case with many speculative subgenres, work that fits the label existed before anybody gave it a special name. In the case of cozy fantasy, it existed well before. The earliest stories that can be seen as laying the foundation of later cozy fantasy date back to the early twentieth century, books like The Wind in the Willows, which includes things that have since become key tropes of cozy fantasy like a focus on community and an idyllic setting that often focuses on homey things like meals instead of descriptions of epic battles and world-scale stakes. Other early precursors of the subgenre came in the 1980s, like the novel Howl's Moving Castle by Diana Wynne Jones and movies made by Studio Ghibli.
The book that many see as the seminal work in the genre is the 2020 novel The House in the Cerulean Sea by TJ Klune. What's interesting is that it was published in mid-March of 2020, which means it was written and slated for publication well before that. In other words, it's the genre's readership and popularity that were influenced by the pandemic, not the book's writing. People have been writing this kind of quieter fantasy for years, but it wasn't until the 2020s that there was a strong enough interest in them for people to actively seek out other stories that share those traits, and justified forming a new subgenre for them.
Common tropes of cozy stories
I mentioned some of these in passing already, but each of the cozy subgenres has its typical set of tropes and traits that readers expect. This doesn't mean that every story includes all of these things, but if it doesn't have at least a couple of them readers might question whether it really belongs to the genre.
A cozy mystery can be generally defined as a lighthearted story centered around a crime being solved by an amateur sleuth, and which doesn't show any on-page gore, graphic violence, or explicit sex. Typical tropes of the genre include:
- A setting that could be described as quaint or charming, like an English village or a bed-and-breakfast on the New England coast
- A protagonist with a comforting, quiet, or hobby-related job, like librarian, antique dealer, cafe owner, or baker
- Protagonist often has a side-kick best friend to help them solve the case and share sarcastic banter
- Protagonist frequently has a love interest, though it's often complicated (a love triangle, a re-appearing ex, etc.)
- Cast of quirky secondary characters, often including archetypes like a local gossip, nosy neighbor, absent-minded professor, charming outsider, wealthy old eccentric, etc.
- A pet frequently features prominently in the story, either as a comforting companion to the protagonist or as a plot mover that notices clues or otherwise helps with the investigation
- While a murder is often the central crime, it takes place off-page
- The crime often takes place during a community or social gathering like a local festival or a major event like a wedding
- Active investigation scenes are usually interspersed with the protagonist's daily routine, which involves comforting, calm activities like gardening, cooking, or having coffee with friends
- Several false suspects are introduced, each with a believable motivation to comimt the crime, then ruled out in the course of the story
- The investigation often unearths the gossip, feuds, and scandals happening in secret in the small town
- Law enforcement often gets involved, and may be friendly toward hte protagonist or tell them to keep out of the investigation
- The perpetrator is caught at the end, and is usually someone who was introduced early from among the town's residents or the victim's friends, family, or neighbors
- The perpetrator is revealed in-scene, with the protagonist talking through what happened step-by-step, often explaining it to a group
- Often riff off of themes like found family, community, and contrasts like tradition vs. change or appearance vs. reality
For cozy fantasy, it can be defined as a kind of “feel-good” subgenre of fantasy, with a focus on more everyday activities and less on global, good vs. evil, let's-save-the-world type plots. The setting is often similar to what you'll find in high fantasy, and it may use a lot of the same character archetypes, but without the violence and epic journeys. Some common traits include:
- Hopeful and optimistic tone, with an emphasis on teamwork and kindness
- Focus on community and character relationships, particularly found families
- Frequently feature queer characters as the protagonist and/or in the central cast
- Protagonist often runs a business like an apothecary, bakery, or similar type of shop
- Protagonist may have a love interest, but it's not the central plot and there's little to no on-page physical romance
- Cast of characters often includes archetypes like a gruff mentor, awkward apprentice, cheerful innkeeper, absent-minded wizard, etc.
- Often take place within a single town and feature locations like tea shops and inns
- Setting is usually a calm, charming, and close-knit community
- Food and drink are usually worked into the book, especially comforting foods like tea or pastries
- Does have conflict, but the stakes are at the community or individual level (renovating a home or business, organizing a local festival, resolving a feud between neighbors, etc.)
- The world is magical, but magic is mundane and everyday, including things like sentient houses, magical knitting needles, enchanted gardens, etc.
- Features kindly fantasic creatures like friendly house spirits or talking cats
- Frequently riffs on the theme of rebuilding or recovery, and the protagonist is often in the process of starting a new life in the town when the story opens
...so you can see from comparing the two that there is a lot of overlap here, and that overlap is the space that I see the term “cozy” inhabiting. Cozy stories are character-driven and chock full of comfort, whether that takes the form of a garden-ringed Victorian inn or a festival in fairy town.
This same idea can be applied in other genres, too. There's cozy horror, which at first glance might seem like an oxymoron but describes stories that have low-intensity jumpscares or an ominous atmosphere but stop short of major violence and end with all the major players still safe and sound. Cozy sci-fi is the same idea as cozy fantasy but with technology instead of magic, usually set on a space station, colony, or alien planet. I've also seen the term cozy romance, which in my mind is a bit redundant but specifically describes a sweet romance set in a small town that features similar protagonists and settings to the other cozy genres.
Now, there are some who would define these subgenres more narrowly than I've done here. The must-haves for each of these genres vary depending on who you're talking to, which is honestly the case for any subgenre. But if you check those big-picture boxes, you'll write the types of stories publishers of these genres look for.
See similar posts:
#Fiction #Genre #WritingAdvice #Fantasy #Mystery
Checking whether a skill does what it says
from  laxmena
Of 214 community skills audited last year, nearly three-quarters scored below 60 out of 100. The failures were mostly invisible: no crash, no error message, just a skill that ran, returned something plausible, and skipped the step that mattered. That gap is the problem I want to work on.
There are already enough skills
By mid-2026 the public indexes held millions of skills, with one scraper listing close to two million on its own. Finding a skill is easy; trusting one isn't.
The trust problem shows up in the numbers. A study of roughly fifty thousand skills in a single registry found that four in five behaved differently from what their own descriptions promised. Most of that is ordinary sloppiness rather than anything malicious: a description that claims more than the skill does, a step that got written down but never enforced. For whoever installs the skill, the effect is the same either way. The label and the contents disagree, and nothing warns you.
Skills fail in two separate places
When a skill lets you down, the break happens in one of two places.
One is activation, the question of whether the skill runs at all. The model reads a short description at startup and decides whether to load the skill. If that description is vague or passive, the skill never fires, and the model just answers on its own. One set of 650 trials found that rewriting the description alone moved a skill's activation from about a third of runs to nearly every run. The whole outcome rode on a single paragraph of metadata.
The other is execution, whether the skill runs all the way through. It loads, the model starts following it, then drops a step, usually a check near the end that produces no visible output. You get a clean, confident answer that never ran its own final verification.
From the outside, these two failures look the same. You asked for something, you got something reasonable, and you have no way to see which of your instructions survived the trip.
What I want to build
A checker that reads a skill and answers one question: does it do what its description claims?
In practice that comes down to three moves:
- Pull out the promises. Every “always,” “before you finish,” and “verify that” in a skill file is a claim about how it should behave.
- Run the skill on a task it says it handles, and record what the model actually did, step by step.
- Compare the two, and report which promises held and which got dropped.
The result is more useful than a single pass-or-fail score: a list of the specific claims that held and the ones that didn't, so an author knows what to fix and someone installing the skill knows whether to trust it.
Starting with a manual pass
I don't want to design the checker before I know the premise holds. So the first move is deliberately low-tech: take ten or fifteen real skills, pull out their promises by hand, run them, and count how often the description and the behavior actually disagree.
If the disagreements are common and easy to spot, the checker is mostly an engineering problem. If the promises turn out to be buried in prose too vague for a tool to pin down, that points somewhere more useful: the thing worth building might be the one that helps people write skills worth trusting in the first place. Both answers are worth the afternoon it takes to find out. And either way, the same principle holds: a handful of skills you can rely on is worth more than two million you can't.
Where the numbers come from:
- The 214-skill audit (nearly three-quarters below 60/100): “Claude Skills Not Working,” buildtolaunch.substack.com.
- Four in five skills deviating from their description: “Behavioral Integrity Verification for AI Agent Skills,” arxiv.org/pdf/2605.11770 (49,943 skills, 80% deviation).
- The 650-trial activation study: summarized at mcp.directory/blog/why-your-claude-skill-isnt-activating-2026-fixes (originally Ivan Seleznov, Feb 2026).
- Close to two million indexed skills, and “discovery is no longer the bottleneck; judgment is”: Agent Skills Ecosystem Report, agentman.ai (SkillsMP figure).
#buildinpublic