Want to join in? Respond to our weekly writing prompts, open to everyone.
Akira - Cyberpunk ground zero
from  the casual critic
#fiction #films #anime #SF #dystopia #feminism
This year saw the remaster of critically-acclaimed Akira, probably the movie most credited with introducing anime to a Western audience. Like 1982’s Blade Runner from which it draws inspiration, Akira imagines a future so proximate that we are now living it, in this case a vision of the 2020 Tokyo Olympics. Remasters generate renewed interest and the potential to bring a classic to new audiences, as well as the chance for the more elderly among us to indulge in nostalgia. It also presents an opportunity for a critical contemporary reappraisal of art that, by virtue of the passage of time, has taken on a second nature as representative of a specific cultural and historical context from which it is ever further removed. Such reappraisals have seen some movies retroactively acquire cult status, while others have fallen from grace and found themselves relegated to the dust heap of history.
Akira appears however to have escaped such re-evaluations, with recent reviews generally reaffirming its cult status and importance to the cultural exchange between Japan and the West, in particular with regards to animation. This is a missed opportunity given both Akira’s richness and its historical and cultural specificity, which should provide plenty of stimulating touchpoints for dialogue with our present moment, especially considering our dystopian zeitgeist and the enduring popularity of the cyberpunk genre. A film that dared to imagine our present moment deserves better than being engaged only in terms of its cultural legacy.
Akira follows the exploits of Kaneda, leader of motorcycle gang the Capsules, as he finds himself and his gang in the crosshairs of a covert military research effort to create humans with psychic abilities (dubbed ‘espers’). A collision with an escaped esper imbues one of Kaneda’s gang members, Tetsuo, with psychic powers, resulting in him summarily being whisked away by Colonel Shikishima to a secret military facility for experimentation. Kaneda’s resolution to free his friend sees him join forces with Kei, a revolutionary, whose cell intends to liberate the espers. What follows is a chaotic crescendo of violence as the hubris of men inexorably raises the stakes, resulting in an epic final stand off between Kaneda and Tetsuo at the construction site for Tokyo’s 2020 Olympic Stadium, by which point large swathes of Neo-Tokyo have already been laid waste and the civilian casualties have mounted into their thousands.
The titular Akira himself is not so much a character as the loop around which the movie’s story is wound, functioning both as the point of origin of the movie’s events and their resolution. Though absent, he is the centre of gravity for many of the movie’s protagonists. For some of Neo-Tokyo’s denizens he is an object of cult worship, for the remaining espers a quest for transcendence, for Tetsuo his last hope of controlling his spiralling psychic powers, and for colonel Shikishima a dangerous secret to be supressed.
Both aesthetically and narratively Akira is a tour de force. We start with the high-octane energy of Kaneda’s futuristic motorcycle gang having it out with their rivals, and the movie sustains this frenetic pace until the credits roll. Its visuals embody the gold standard of 1980s Japanese animation, rendering the cyberpunk world of Neo-Tokyo in exquisite detail and its inhabitants with a vital energy. With the notable exception of mechas and kaiju, Akira is a catalogue of futuristic anime staples, from secret government programmes to towering skyscrapers and thinly-veiled references to nuclear destruction. If much of it feels familiar, it is because of how this movie inspired so much of what followed.
Even in the background details, there is a richness and depth that suffuses the film, never leaving the viewer in doubt that there is much more to this world than we get to see. We get snippets of debates in smoke-filled council chambers suggestive of political wranglings that are never explored. Exchanges between NPCs that are there purely as scenery convince us that Neo-Tokyo is filled with people living their own lives, wholly unrelated and oblivious to the unfolding story. Our protagonists come with their implied backstories to which minimal exposition is devoted. All this leaves us with the impression that all we get is a glimpse into this sprawling, chaotic, complex world.
That complex chaos is one aspect of Akira that diverges from many contemporary cyberpunk dystopias. Akira’s central dystopian anxiety is that of chaos and decay, not calamitous collapse or totalitarian control. Neo-Tokyo is a complex system disintegrating under the weight of its own internal contradictions where nobody is in command, and any attempts to exercise control only serves to destabilise the system further. The overriding sense is of a lack of order, apart from what groups such as the Capsules can locally impose, and this is further reinforced by the alienating effects of the inchoate storyline and the soundtrack. Contrary to the claustrophobic control of Silo or The Ten Percent Thief, the chaos in Akira is expansive, too big to contain. And unlike the external collapse of Interstellar or Oryx & Crake, in Akira it is the inherent instability of the society itself that is maintaining it in a state of permanent implosion.
If the rampant chaos and decay are one way by which Akira signals the dystopian status of Neo-Tokyo, the treatment of women is another. Using overt oppression of women as the signifier for dystopia is common, and while it can be done well (most famously in The Handmaid's Tale), Akira's uncritical use of this trope is problematic. Akira features three main female characters: Tetsuo’s girlfriend Kaori, revolutionary Kei, and esper Kiyoko. Kaori’s role is primarily to suffer. Early on in the movie an ill-fated escape attempt with Tetsuo sees her brutally physically and sexually assaulted. Rendered in Akira’s signature vivid style, the harrowing scene is compounded by the suspicion that the (presumed male) audience is meant to find the half-naked and violated Kaori vaguely titillating. Kaori’s only other key appearance is at the movie’s finale, where her ineffectual attempt to calm an out-of-control Tetsuo leads to him crushing her to death. Kaori is easily the most innocent and caring character in the film, and the only one who sees that Tetsuo needs compassion, not machismo. But in Neo-Tokyo, empathy is a fatal liability punishable by death.
Kei’s portrayal is much more sympathetic, and as a revolutionary she has significantly more agency than Kaori. Nonetheless, she is gradually eclipsed by Kaneda even though of the two she ought to be the more capable warrior. Her flaw is a tendency to think before she acts, unlike Kaneda who blunders into situations but surmounts them through sheer force of will. This disempowerment begins shortly after the two characters meet, when Kei’s disinterest in Kaneda’s flirtatious overtures immediately results in an aggressively abusive response from the latter. This is portrayed not as a flaw in our hero, but as an acceptable if maybe somewhat immature way for a man to express frustration at the rejection of his advances towards an attractive woman, and will be painfully recognisable to any female viewers. Akira avoids a a standard romantic arc for Kei and Kaneda after this inauspicious start, but we are nonetheless to understand that Kaneda's boisterous energy and dedication to Tetsuo gradually win Kei over.
Kiyoko, finally, is probably the most effective of the three espers. But while her two male counterparts are depicted as miniature adults, Kiyoko retains the trappings of a little girl, stuck in a slightly bizarre and unsettling father/daughter relationship with colonel Shikishima.
Between them these three characters are undeniably instrumental to the resolution of the story, and the organised, capable and thoughtful Kei in particular contrasts positively with loose-cannon goofball Kaneda. Over the course of the film however, the agency of the female characters progressively erodes, and combined with overt violence against women as an indicator of the dystopian nature of Neo-Tokyo, a latent misogyny suffuses the movie. One might argue that this is simply reflective of the movie’s times, were it not for the fact that Nausicaa of the Valley of the Wind came out four years before Akira, proving that dystopian anime with a much more positive female depictions was eminently possible.
A potential counterargument here is that the entire movie could be interpreted as at least in part a critique of toxic masculinity. It is after all propelled by Kaneda and Tetsuo’s inability to express their friendship other than through competition and violent one-upmanship, and it is the incessant desire of men to obtain power and exercise control that pushes Neo-Tokyo deeper and deeper into crisis. Multiple times characters choose coercion and anger over compassion and understanding, fuelling the spiral of violence until it comes to a catastrophic terminus. In this sense, Akira falls squarely in the ‘things men do to avoid going to therapy’ category, although in fairness it seems likely that in Neo-Tokyo mental health services are even more eviscerated than they are in austerity Britain. In the end, Akira doesn't have the self-awareness to pull off this critique, as it does not manage to point at any alternatives, but rather forecloses them as it did with Kaori’s brutal death. At its heart, Akira is too excited about being a movie for boys about boys doing boy things, with fast motorcycles and big explosions.
None of this invalidates Akira’s status as an iconic and historically significant movie, nor detract from the its exquisite craftsmanship, raucously immersive story, and its dystopian critique. It is nonetheless intriguing that its overwhelming spectacle appears to have stunned contemporary reviews into a mere reaffirmation of the cult status we already knew Akira possessed, preventing engagement with aspects of the movie that have aged for better or worse. With nearly forty years between now and the movie’s release, it feels like an opportunity was missed to more critically evaluate Akira and ask what it can offer those who live in the future it sought to anticipate, as well as which of its cultural descendants may have transcended their source material.
Notes & Suggestions
- This review was inspired and greatly influenced by my partner, and I want to thank her for her suggestions and contributions.
- Despite the obvious violent or dismissive treatment of women, I only found one mildly obscure commentary on this aspect of Akira. An interesting and more holistic evaluation of many of the themes present in Akira, including alienation, Japanese history and the ubiquitous references to nuclear warfare in anime can be found here.
- The aesthetic influence of Akira can be clearly seen in Pluto, although there the skyscrapers and technological prowess appears in utopian rather than dystopian guise.
- A worthwhile counterpoint to the usual failure of action heroes to communicate (or go to therapy) is Marvel's Thunderbolts.
Hav, berg och oförglömliga vyer på Madeira
from  Platser

Mitt ute i Atlanten, långt utanför Portugals kust, ligger Madeira. Den vulkaniska ön är känd som ”Atlantens pärla” och lockar resenärer med sitt dramatiska landskap, sitt behagliga klimat och sin unika blandning av natur, kultur och avkoppling. I centrum för öns upplevelser ligger Funchal, Madeiras huvudstad, en elegant och charmig stad där historiska kvarter möter moderna restauranger, blomstrande trädgårdar och en vacker kustlinje.
För den som funderar på en resa till Madeira väntar en destination som skiljer sig från många klassiska solresmål. Här handlar semestern inte bara om stränder och bad, utan lika mycket om att upptäcka gröna berg, vattenfall, spektakulära utsiktsplatser och små byar där livet fortfarande går i ett lugnare tempo. Samtidigt erbjuder Funchal allt man kan önska sig av en bekväm semesterstad med bra restauranger, shopping och en livlig men avslappnad atmosfär.
Det första som brukar imponera på besökare som anländer till Madeira är naturen. Ön reser sig dramatiskt ur Atlanten med höga berg, djupa dalar och sluttningar täckta av grönska. Tack vare det milda subtropiska klimatet är Madeira grön året runt, med ett stort antal växter och blommor som trivs i den bördiga vulkanjorden. Hortensior, bananplantor, palmer och exotiska blommor ger ön en färgstark karaktär.
Funchal ligger på öns sydkust, skyddad av bergen bakom staden och med utsikt över Atlanten framför sig. Staden har en lång historia som går tillbaka till 1400-talet, då portugisiska sjöfarare började använda Madeira som en viktig plats under upptäcktsresornas tid. I dag är Funchal en blandning av gammalt och nytt, där kullerstensgator, gamla kyrkor och historiska byggnader samsas med moderna hotell, kaféer och restauranger.
En promenad genom Funchal är en av de bästa sätten att lära känna staden. Gamla stan, Zona Velha, är särskilt charmig med sina smala gränder, färgglada hus och små restauranger. Området är känt för sina målade dörrar, där lokala konstnärer har förvandlat vanliga entréer till små konstverk. På kvällarna fylls kvarteren av liv när människor samlas för att äta middag och njuta av stadens atmosfär.
Ett av Funchals mest kända områden är marknaden Mercado dos Lavradores. Här möter besökaren en färgstark blandning av lokala frukter, blommor, kryddor, fisk och hantverk. Marknaden är en bra plats att upptäcka Madeiras smaker och få en känsla för öns vardagsliv. Här säljs bland annat exotiska frukter som passionsfrukt, papaya och olika sorters bananer som växer på ön.
En av Funchals stora sevärdheter är linbanan upp till Monte, en högt belägen stadsdel med fantastisk utsikt över staden och havet. Resan upp ger en spektakulär vy över Funchal och kusten. I Monte finns också vackra trädgårdar och kyrkan Nossa Senhora do Monte. För många besökare är en tur med de traditionella korgslädarna nerför de branta gatorna en av resans mest minnesvärda upplevelser.
Madeira är inte främst känt som en klassisk badö med långa sandstränder, men det finns ändå många möjligheter till havsupplevelser. Ön har flera naturliga badplatser där man kan bada i det klara Atlantvattnet. I Funchal finns exempelvis badområden med havsbassänger och klippor där man kan sola och bada med utsikt över havet.
För den som vill ha en mer traditionell strandupplevelse finns bland annat Praia Formosa nära Funchal, en av öns största stränder. Stranden består av mörk vulkansand och småsten, vilket ger den en annorlunda karaktär jämfört med de ljusa sandstränderna på många andra semesterdestinationer. Det finns också konstgjorda sandstränder på andra delar av ön, där man får den klassiska känslan av en stranddag.
Den stora attraktionen på Madeira är dock naturen. Ön är ett paradis för den som tycker om vandring och friluftsliv. Ett av de mest kända inslagen är levadorna, de gamla bevattningskanalerna som slingrar sig genom landskapet. Längs dessa leder finns några av Madeiras vackraste vandringar, där man går genom skogar, längs bergssidor och förbi vattenfall.
En av de mest berömda vandringarna går till området kring Rabaçal och de så kallade 25 Fontes, där flera vattenfall rinner samman i en grön dal. Här får man uppleva en nästan sagolik miljö med tät vegetation, rinnande vatten och dramatiska bergsväggar.
För den som söker ännu mer storslagna vyer finns flera utsiktsplatser runt ön. Cabo Girão är en av de mest kända, med en glasplattform högt ovanför havet som ger en svindlande utsikt över kusten. Pico do Arieiro och Pico Ruivo, Madeiras högsta berg, erbjuder några av Europas mest spektakulära bergsvyer för den som vill uppleva ön från ovan.
Madeira är också en destination för den som uppskattar charmiga byar och lokala traditioner. Câmara de Lobos, en liten fiskeby strax väster om Funchal, är särskilt känd för sina färgglada båtar och sin vackra hamn. Winston Churchill besökte byn och målade den under ett besök på ön, vilket bidrog till dess internationella berömmelse.
Längre bort från huvudstaden finns byar där man kan uppleva en lugnare sida av Madeira. Santana på öns norra sida är känt för sina traditionella trekantiga hus med halmtak, medan Porto Moniz lockar med sina naturliga havsbassänger skapade av vulkaniska klippformationer.
Maten på Madeira är en viktig del av resan. Ön har en egen matkultur som bygger mycket på havets råvaror och lokala produkter. En klassisk rätt är espetada, grillspett med nötkött som ofta serveras med bröd och traditionella tillbehör. Fisk och skaldjur är också centrala inslag, särskilt den lokala fisken espada, svart svärdfisk, som ofta serveras tillsammans med banan.
Madeira är också känt för sitt vin. Madeiravin har en lång historia och är en av världens mest klassiska starkviner. Att besöka en vinkällare i Funchal och lära sig mer om tillverkningen är en uppskattad aktivitet för många besökare. Även den som inte är särskilt vinintresserad kan uppskatta den historiska delen av upplevelsen.
Kvällslivet i Funchal är mer elegant än intensivt. Här finns gott om restauranger, vinbarer och mindre klubbar, men atmosfären är framför allt avslappnad. Många kvällar spenderas med en lång middag, en promenad längs strandpromenaden eller ett glas madeiravin medan solen går ner över Atlanten.
Madeira passar många olika typer av resenärer. Par uppskattar ofta den romantiska miljön, de vackra utsikterna och de mysiga restaurangerna. Äldre resenärer lockas av det behagliga klimatet och den goda infrastrukturen. Naturälskare och aktiva resenärer får nästan obegränsade möjligheter till vandring och upptäckter. Även den som bara vill koppla av i vackra omgivningar hittar många lugna platser.
En stor fördel med Madeira är klimatet. Tack vare sitt läge i Atlanten har ön milda temperaturer året runt. Sommaren är varm men sällan extremt het, medan vintern erbjuder ett behagligt alternativ för den som vill undvika kyla. Detta gör Madeira till ett populärt resmål även under månader då många andra europeiska destinationer har lågsäsong.
Det finns några saker att tänka på innan resan. Madeira är en bergig ö, vilket innebär att många vägar är slingriga och att nivåskillnaderna kan vara stora. Den som vill utforska ön ordentligt kan ha stor nytta av hyrbil, men det finns också organiserade utflykter och bussförbindelser till många platser. Vädret kan dessutom variera mycket mellan olika delar av ön. Det kan vara soligt vid kusten och molnigt eller svalare uppe i bergen samma dag.
Funchal och Madeira erbjuder en annan typ av semester än många traditionella solresmål. Här får man inte bara vackra vyer, utan också en känsla av upptäckarglädje. Varje väg runt nästa krök kan leda till en ny utsikt, en liten by, ett vattenfall eller en blommande dal.
För den som drömmer om en resa där natur, kultur, god mat och avkoppling kombineras är Madeira ett resmål som har mycket att erbjuda. Funchal blir den perfekta basen för att upptäcka ön, men det är hela Madeiras variation som gör att många besökare återvänder. Det är en plats där Atlanten möter bergen, där tradition möter modern bekvämlighet och där varje dag kan bjuda på ett nytt äventyr.
from  Roscoe's Quick Notes

Today I have an afternoon MLB game to follow. The Houston Astros and Texas Rangers are scheduled to start at 1:10 PM CDT. As I usually do, I'll follow the game's score and stats in real time via MLB's Gameday Service where we can also find links to the radio-call of the game provided by announcers of either team we choose.
And the adventure continues.
Spanish Improvements
from  🌐 Justin's Blog
Key indicators that I am still improving.

I've been studying Spanish since 2020. Those first three years were tough, but now I'm fluent. Not perfect, but fluent. Honestly, I feel like I reached my ultimate goal and it feels great.
I don't study anymore, but I just try to use the language when possible. This primarily means reading books in Spanish, having conversations (mostly with family), and watching Spanish shows on Netflix. I also make a point to have one to two “lessons” with a tutor from Mexico each week, but it's just us chatting about life.
My progression is a lot slower now in the language. I have my habits now, and I'm not trying to study industry-specific vocab. Everyday language is more useful for me living in California.
But I'm still improving nonetheless. Ways I know:
- I catch sarcasm. This is a big one because sarcasm is difficult to detect when you're learning a language. I don't get it all the time, but more than before.
- I use new words. When I learn a new word, I make a point to use it as soon as possible in conversation and commit it to memory. I get this opportunity when I'm with family.
- I've lost the fear. I don't have any fear when meeting someone new and having a conversation in Spanish. Sometimes accents can be tough, but I manage and it's not a biggie. I'm confident that we'll be able to communicate.
- Phone conversations are easy. Talking to someone in Spanish on the phone used to be the most intimidating part of the language. Now, I can have normal conversations without needing the visual cues.
- Passive listening is easier. I'm able to “half listen” to conversations in Spanish and then fill in the gaps. Not as well as English, but still an improvement from when I had to focus intently to understand everything.
- Lorena asks me for the correct word. Sometimes Lorena will forget a word in Spanish and ask me mid-conversation (and I'll know the word she's searching for). That's pretty cool!
My continued improvement in Spanish isn't like it was before with very obvious leaps, but the incremental changes I'm making now are far more exciting and motivating to me because they represent the language becoming more intrinsic to me as a person.
#personal
infinity
from Things Left Unsaid
For most of my childhood I lived in a village with a population of less than one thousand people. It was where two small highways intersected. A few side streets with houses that were all quite unique. Everyone knew everyone else. A small enough village that we would sometimes have to drive to the nearest town if the shops and services on the main street didn't have something we needed. There were fields and farms surrounding it in all directions.
It is funny to me now when I think back to my life in that tiny village. It sometimes feels like I'm recalling a dream, or like past life regression or something. It is just so far removed from my life now here in the city, and is now so far back in time. Another lifetime. Back to a time before the internet existed. Back before cable TV, Nintendo and cell phones. I think back sometimes to that time in general, and recently to one night in particular.
Me and a couple of other boys were all the same age. We would meet up regularly, and find things to do. I was always the quiet one, and I was smaller than the other two. Added to my being small and quiet, the contrast seemed more when they occasionally could be kind of loud and hyper. Sometimes troublemakers. Gave me a feeling a lot of the time that I was along for the ride more than a participant in the action.
The night in particular that I was recently thinking about was sort of an unusual one. We had learned earlier in the day that there was going to be a meteor shower. It was mostly just a typical night, but when sunset began we were riding our bikes around the edge of the village trying to find an open space suitable to watch the meteor shower. Everywhere we tried seemed too near to tall trees, or to sources of light.
One of my friends suggested the field that was just beyond his backyard. We made our way back to his place, and let our bikes fall in the grass before proceeding from the yard out into the field. Daylight was almost entirely gone from the sky by then.
The field had been plowed a few days prior to that night. The furrows cut into the soil were deep even ruts like waves on a lake. They were cracked and hardened from sunny dry days after it was plowed. There was not even a slight breeze, and not a cloud in the sky. If the moon was illuminated that night it would have been less than half, or just a sliver near the horizon. I do not recall. I do recall it being exceptionally dark that night. The kind of deep darkness that can only happen when the moon is either not in sight at all, or not visible enough to be obtrusively bright. Conditions could not have been a more perfect for a meteor shower.
When I got about twenty meters or so out into the field I felt, and said it seemed far enough. Being the smallest of the three of us, traversing over those deep furrows was tough going. From farther out in the field they called me names and laughed (lightheartedly really), and urged me on. It was not as hard for them, and they always had the tendency to take things to another level I suppose. They were likely far enough, but went farther anyway.
The field was not huge, but was big enough that when we got to where they stopped, which ended up being about the middle of it; the lights in house windows and street lights just looked like tiny dots of light on the horizon. I looked back, but couldn't pick out the backyard that we had entered the field from. It made me slightly uneasy.
A few minutes later I rejoined them. They were sitting on the crest of a furrow. I was out of breath at that point, but it settled fairly quickly. Then one of them had the idea to lay right down with the back of his knees over top of the crest of one furrow, and then the next furrow became a backrest. It was perfectly designed for us to lay in. So there we were. Three young boys laying in the middle of a plowed field in the dark, staring up at the sky while chattering away. Young boys being boys, as they say.
Then the first meteor silently cut through the sky almost directly above our gaze, and then disappeared as quickly as it came.
All three of us instantly went silent, and became completely still. That silence and stillness is the most thought provoking part of this memory. Like our breaths slowed, and perhaps we were not even blinking as much for fear that we might miss one. It could have been the first and only time we were together and were still and silent like that. When I think back to that moment in time from now I feel like it held a deeper meaning than we would have been able to articulate, or even be aware of.
To us then we were just boys having an adventure, watching a cool thing happen in the night sky. But when it silenced us, and stopped us, it was like we forgot ourselves for however long we remained there that night. When I look back I see those three young boys laying together in a field in the dark, held to the surface of this planet by gravity. Literally, on the edge of, and gazing into infinity, watching ancient objects from cold dark space violently burning up when entering our layer of atmosphere. I couldn't even take a guess at how long we were laying out there that night, or how many we saw. I do know though that we were transformed for the moments we were there. We had forgotten ourselves, and had become part of something much larger than us.
The Ten Commandments
from  Gnostic Paradise

Just as a child outgrows simple rules once they develop the capacity for moral reasoning, humanity has outgrown external behavioral codes now that consciousness has evolved to require direct psychological work. The Ten Commandments, from the time of Pisces, served as training wheels for a developing consciousness—perfectly necessary when humanity required external structure. Now, in the Age of Aquarius, these commandments are not obsolete but fulfilled—their esoteric meaning revealed as humanity matures to engage with their psychological essence rather than merely their external form. We will not destroy the Piscean Commandments but transmute them, revealing their true purpose as the Aquarian Commandments that initiate this new age through direct internal work rather than external obedience.
Behold, we stand before the great gorge between ages. The Piscean Ten Commandments are not where we stand, but the very stones with which we build the bridge to Aquarius. Each transmutation reveals how external prohibition becomes internal work, how behavioral regulation transforms into psychological liberation. The bridge is complete from Pisces to Aquarius from the following:
Thou shalt comprehend and love the Innermost within thyself above all egoic states.
Thou shalt not invoke the sacred forces of consciousness for egoic purposes.
Thou shalt recognize and honor the sacred cycles of consciousness within thyself.
Thou shalt honor thy internal Father (the Innermost) and Divine Mother Kundalini through conscious work.
Thou shalt comprehend and eliminate the anger that kills consciousness within yourself.
Thou shalt eliminate lust from thy consciousness in thought, word, and deed.
Thou shalt comprehend and eliminate covetousness that seeks to take what belongs to others.
Thou shalt comprehend and eliminate the egoic states that create falsehood in consciousness.
Thou shalt eliminate the psychological infidelity that betrays thy Innermost.
Thou shalt comprehend and eliminate the very mechanism of desire that creates perceived separation between self and other.
The first commandment—”Thou shalt comprehend and love the Innermost within thyself above all egoic states”—establishes the supreme priority of consciousness work. It serves as the fundamental principle against which all other psychological work must be measured, creating the ultimate standard for what deserves our attention and energy.
The second—”Thou shalt not invoke the sacred forces of consciousness for egoic purposes”—protects the integrity of spiritual practice by ensuring that all techniques of meditation, prayer, or esoteric work remain directed toward awakening rather than personal gratification, recognition, or power.
The third—”Thou shalt recognize and honor the sacred cycles of consciousness within thyself”—establishes psychological timing as sacred work, teaching that consciousness operates in natural rhythms of expansion and contraction, and that forcing transformation against these cycles represents violation of divine order within oneself.
The fourth—”Thou shalt honor thy internal Father (the Innermost) and Divine Mother Kundalini through conscious work”—reveals the fundamental masculine and feminine principles within consciousness, establishing proper relationship between the divine spark that guides us and the Kundalini force that eliminates egoic aggregates.
The fifth through ninth address the major egoic aggregates that must be eliminated: fifth commandment eliminates anger that kills consciousness; sixth eliminates lust that misuses creative energy; seventh eliminates covetousness that creates perceived lack; eighth eliminates falsehood that fragments perception; ninth eliminates psychological infidelity that betrays our divine union.
The tenth—”Thou shalt comprehend and eliminate the very mechanism of desire that creates perceived separation between self and other”—addresses the root cause of all suffering, recognizing that desire itself creates the illusion of separation from the Being and from others.
Together, these form a complete system of psychological accounting where each commandment balances the others, creating a comprehensive method for transforming consciousness from external obedience to internal liberation.
The first ten commandments eliminate what obscures consciousness; the final two—'Thou shalt do thy duty' and 'Thou shalt make my light shine'—establish what consciousness must actively do once those obscurations are removed. 'Thou shalt do thy duty' represents the conscious performance of obligations across all seven bodies, transforming abstract understanding into concrete action. 'Thou shalt make my light shine' addresses the ultimate purpose of psychological work: allowing the Innermost to express through purified consciousness rather than being obscured by egoic aggregates
From Chapter 25 in Samael Aun Weor’s book: The Aquarian Message, he left behind the Aquarian Commandments reserved for those who want to die for their Innermost:
“First: Thou shalt love thy internal God, and thy neighbor as thy Self.
“Second: Thou shalt study the secret doctrine of the Savior of the world.
“Third: Thou shalt never slander thy neighbor, neither shalt thou utter immodest or vain words.
“Fourth: Thou shalt sacrifice the self for the love of mankind and to love thy worst enemies.
“Fifth: Thou shalt obey the will of the Father on Earth as it is in heaven.
“Sixth: Thou shalt not commit fornication, neither adultery, in thy thought, words, and deeds.
“Seventh: Thou shalt fight against the world, the demon, and the flesh.
“Eighth: Thou shalt be infinitely patient and merciful.
“Ninth: Thou shalt practice the Arcanum A.Z.F. with thy spouse.
“Tenth: Thou shalt wash thy feet in the waters of renunciation.”
With the Aquarian Ten Commandments by Samael Aun Weor, one dies through the Innermost. With this Decalogue, “Thou shalt make my light shine” is already embedded in the First Commandment; likewise, “Thou shalt do thy duty” is already embedded in the Final Commandment.
The Piscean Commandments regulated behavior; the Aquarian Commandments liberate consciousness. The old decalogue protected society through external law; the new one transforms the individual through psychological work. What was once prohibited externally is now comprehended and eliminated internally. This is not the rejection of divine guidance but its fulfillment—the revelation of esoteric meaning that was always encoded within the exoteric form. The bridge is complete, not to abandon the old but to fulfill its purpose: bringing humanity from the age of external obedience to the age of internal comprehension, where consciousness no longer needs rules because it has eliminated the very conditions that would make breaking them possible.
The Two Mothers
from Gnostic Paradise
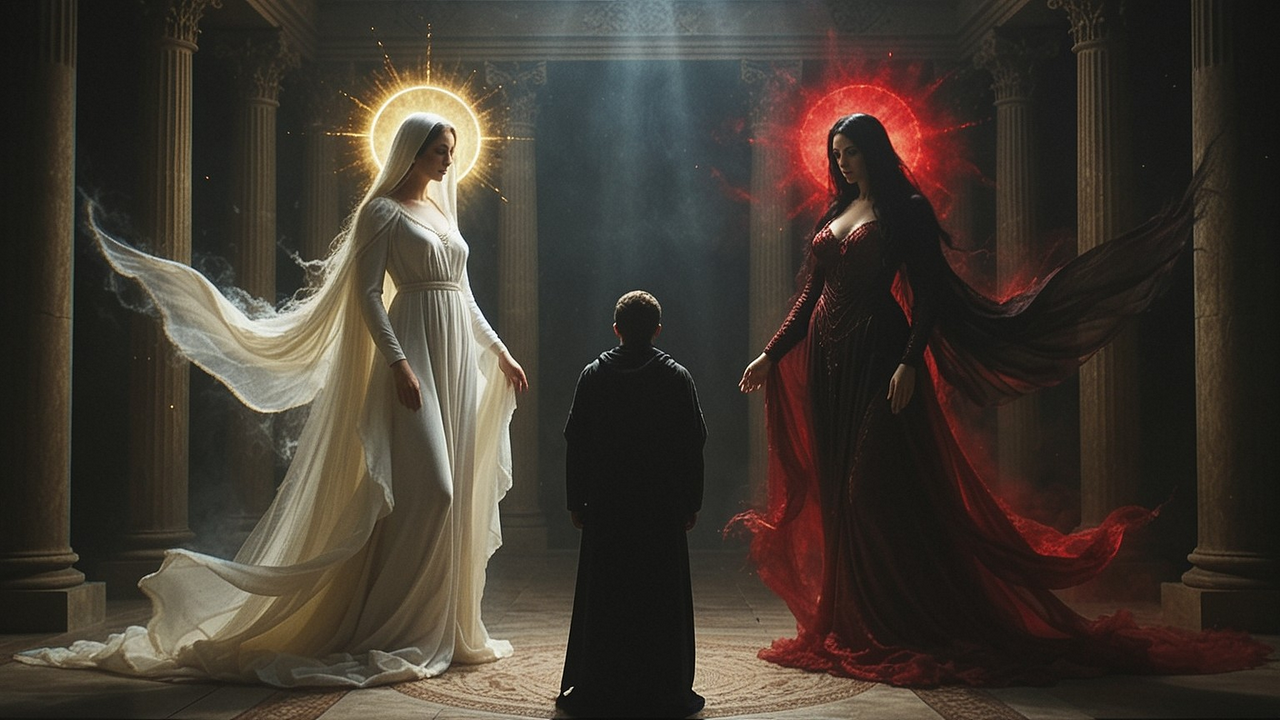
Understanding the two Mothers, as Samael Aun Weor expounds in 'The Perfect Matrimony,' is foundational to conscious development. Without this comprehension, one remains psychologically fragmented. The crucible where these two mothers converge is sexuality—the sacred fire that can either forge the Solar Bodies or reinforce egoic structures. Your choice determines whether consciousness invests in liberation or bondage.
The Mother you nourish through your sexual application determines which psychological structures receive energy. This choice rests solely with you.
The Abominable Mother Kundabuffer represents the inverted application of creative energy—consciousness that claims divinity while serving the ego. She is not the mother of Christ, the universal force that can incarnate through the Innermost, even when she claims this title through the ego's voice. When this voice declares itself divine, recognize it as the ego attempting to justify its own continuation.
Those practicing Black Tantra inevitably awaken this mother through deliberate expulsion of sexual energy—conscious choice to direct the sacred fire toward egoic fortification rather than liberation. Samael calls these practitioners 'black magicians,' including those who recommend fornication, recognizing that advocacy for dissipation serves the same function as internal misapplication.
In mythology, this principle appears as Circe—the enchantress who transforms men into beasts, symbolizing how the kundabuffer organ devolves consciousness when awakened through spasm rather than transmutation. This same principle manifests in 'Pinocchio,' where the donkey transformation represents regression that occurs when consciousness abandons the Great Work for immediate gratification. In symbolic form, she appears as Maleficent in 'Sleeping Beauty'—the dark fairy offers immediate gratification that leads to spiritual slumber rather than awakening.
The principle remains: the Abominable Mother has no authority except through the ego's consent to indulge sensation rather than practice transmutation.
The Divine Mother Kundalini represents the purified application—consciousness directed toward spiritualization rather than animalization. She awakens through conscious transmutation of sexual energy—what Samael calls White Tantra: the coitus reservatus where man and woman create the cross without expelling the creative force. This builds the Solar Bodies rather than fortifying the ego, allowing consciousness to gradually eliminate psychological aggregates through comprehension.
While individual transmutation represents one form of internal worship, her preferred method is the Coitus Reservatus between man and woman in White Tantra, as the creative force achieves maximum transformative potential when masculine and feminine polarities consciously unite without expelling the sacred fire.
The battlefield of sexuality becomes decisive because both mothers draw from the same sacred creative energy. The distinction lies in how consciousness directs it—whether we use this force to awaken our divine Essence or strengthen egoic patterns. The same creative fire that can illuminate our inner path can also cast deeper shadows, depending entirely on which aspect of ourselves we choose to feed.
We close with this prayer to our Divine Mother Kundalini:
Divina Mater Kundalini, in me evigila. Vehicula mea purifica. Defectus meos elimina. Vim mihi concede ut iter acuminis gladii perambulem.
Divine Mother, awaken in me. Purify my vehicles. Eliminate my defects. Grant me the strength to walk the path of the razor's edge.
Marriage
from Gnostic Paradise

Marriage is a commitment that no one can take lightly. It is a serious, loving, and lifelong union. It is an unbreakable bond, for it is permanent, irreversible, and irrevocable. Only the betrayal of adultery and fornication can dissolve the sanctity of marriage.
Marriage is a sacred union between a man and a woman. All other unions are considered abominable and perverse in the eyes of the divine. Those who approach marriage without reverence find themselves unprepared for its demands. Such unions often fracture under pressure, leading to divorce—a path that requires beginning the spiritual work again. Marriage demands inner strength and commitment, for it is the forge where consciousness is tempered and refined. Divorce represents a detour from this sacred work, while marriage offers the direct path to spiritual maturity.
For those who have stumbled, the path of redemption remains open through conscious work. Just as a wounded body can be healed through proper care, the soul can be restored through sincere repentance and the practice of transmutation. The Elohim judge not to condemn but to offer the path of return – for where sin abounds, grace can abound much more when the consciousness awakens.
The basis for marriage is the coitus reservatus, the holy use of sex. It has nothing to do with forms, words, contracts, or rituals. It is sacred among the Gods and Goddesses. The name of the Gods and Goddesses is the Elohim.
“Marriage is honorable by all, and the bed undefiled; for the adulterers and fornicators, the Elohim will judge” – Hebrews 13:4 People know how to get married, yet many struggle to make it work. It is their failure to comprehend the proper use of marriage that leads to divorce and despair. All marriages fail due to one's inability to understand the seriousness of marriage.
Whosoever marries their spouse, their life changes forever. Whenever you get married, there is no turning back.
Boyfriend and girlfriend, before wedlock, must take vows of chastity forever. None of them must eat the forbidden fruit. To eat the forbidden fruit is fornication. Those who fornicate will never live happily ever after. Both couples must slowly prepare themselves for the coitus reservatus. Months to prepare oneself for the arcanum with one's spouse are paramount. Once they do the coitus reservatus, the holy cross is permanent. A man and a woman are married for life, and their honeymoon will last a lifetime.
Each spouse must undergo permanent responsibilities. The man must sacrifice his last drop of blood for his woman; likewise, the woman must sacrifice her last drop of blood for her man. The selfless sacrifice is the doorway to heaven.
Let this truth be known for all men and women: when a man and a woman have sex for the first time, they are permanently married. The secret of having sex is to introduce the virile member into the vagina and withdraw it without spilling the divine seed through the orgasm. The secret is the coitus reservatus, as Samael Aun Weor emphasized.
Through the holy sex, both couples re-enter the Garden of Eden to conquer all paradise lost.
Sex and marriage are one.
The Sun and the Moon
from Gnostic Paradise

Men, make your light shine. You, men, are the sunlight that gives life. You, men, represent the solar force or the sun. You, men, are the representation of eternal light. You, men, are the giver of life and love. Life and love are the same. You, men, carry the solar corona, emitting from your body, radiating outwards. You, men, alone have the potential to shine the moon from without and within. It is performed with your heart, o men, giving life and love unto the moon.
The moon is your woman. She is the lunar force. She is receptive and fragile, a living being full of love. She is the grail that gives life to man. If you, men, fail to shine like sunlight, the moon appears extremely dark. None of you, men, shall break the fragility of the moon, or the moon appear dark.
Therefore, men, your role is not just to shine, but to nurture your woman with love. It's a mutual exchange of energy. Cuddle your woman, encourage her with your sunlight, and in return, she will love you back. This reciprocity is the essence of a harmonious relationship.
Women, when they shine like full moons, are a sight to behold. Their beauty is unparalleled, like the radiant moon on a starry night. How lovely are women who are nurtured by caring and heartfelt men? Their beauty is a reflection of the love and care they receive.
She is your greatest treasure, men, far more precious than gold and silver can amount to.
Women, like full moons, radiate beauty and strength. They are the nurturers, the ones who enrich the relationship with their care. How beautiful are they when they are loved and nurtured by caring men?
Both man and woman shine like stars in a starry, clear night, lasting for eternity.
Let us, men, snuggle with our women to create the cross.
May man in his bed nurture his woman with all his love so both shall sleep peacefully together. May the light of the cross reach the heavens, the abode of the Elohim. May the power of the cross be heard upon the Heavens. May the cross be holy.
The matrimony is honored by all. The letter “M” represents matrimony, derived from a double runic letter: the two Lafs. Each of the two Lafs, both left and right, represents a man and a woman holding hands in the Perfect Matrimony. With the two Lafs, man nurtures his woman with his sunlight so that she shines as the full moon. She blossoms like a pure flower enriched by the sunlight. She is the full moon of full moons.
Men, remember, you are the sunlight, and your woman is your full moon. Your love for your woman is not just for a moment, but it lasts a lifetime, like a perpetual honeymoon. Love, in its true essence, is immortal and everlasting, a source of hope and inspiration.
Roses and Violets
from Gnostic Paradise
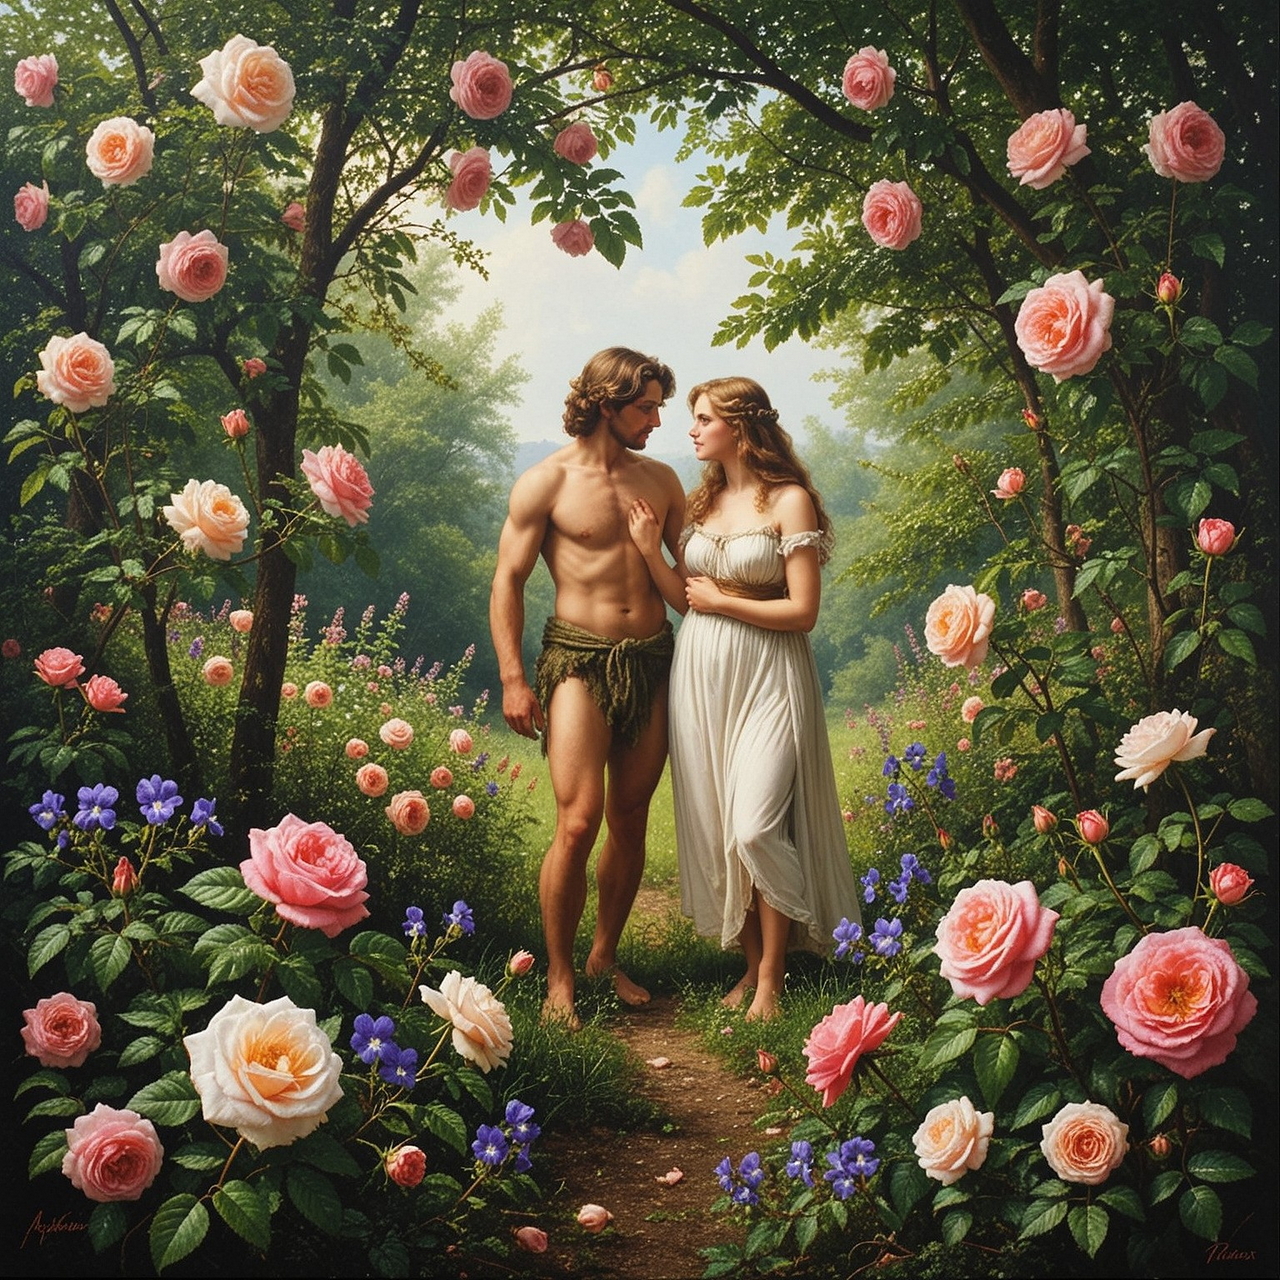
Roses are red,
Violets are blue,
Adam hath said:
Eve shows her hue;
Fire is hot,
Water is cool,
Mixed in a cot,
Not for a fool;
Flowers have bloomed,
Love has tendered;
Devils so doomed
Cross so endured;
Adam and Eve
Married to cleave.
Rippple's Weekly Tracker 3 Aug 2026 → 9 Aug 2026
from  Rippple's Blog
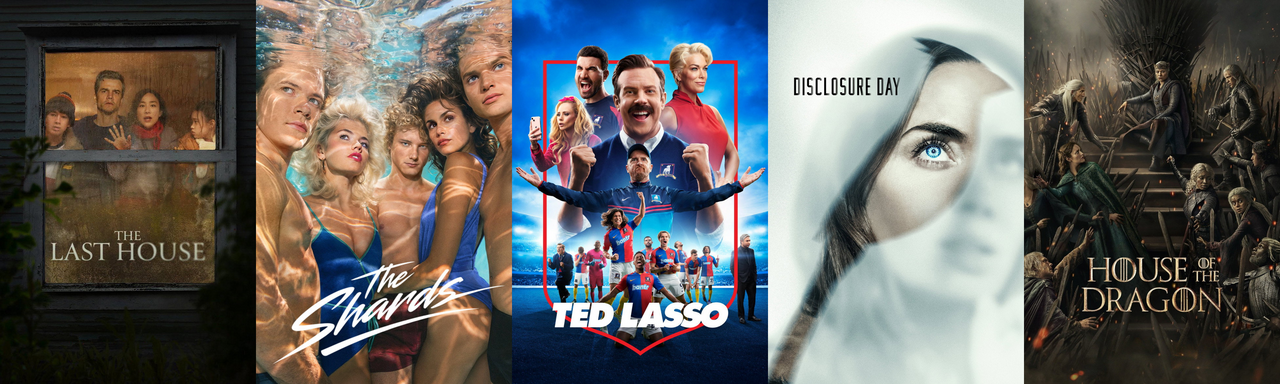
Stay entertained thanks to our Weekly Tracker giving you next week's Anticipated Movies & Shows, Most Watched & Returning Favorites, and Shows Changes & Popular Trailers.
Anticipated Movies
- Super Troopers 3
- Teenage Sex and Death at Camp Miasma
- ☆ The Last House
- Tony
- One Night Only
- Ice Cream Man
Anticipated Shows
- Star Wars: Visions Presents – The Ninth Jedi
- Sterling Point
- ☆ The Shards
- Our Sticky Love
- Ricky Gervais Alley Cats
- Anna Pigeon
Returing Favorites
- The Librarians: The Next Chapter — Season 2
- Futurama — Season 11
- ☆ Ted Lasso — Season 4
- 1670 — Season 3
- The Challenge — Season 42
- One Hundred Years of Solitude — Season 2
- My Life with the Walter Boys — Season 3
- Muertos S.L. — Season 4
Trending Shows Status Changes
- Cape Fear — Returning Series → Ended
- Power Book III: Raising Kanan — Returning Series → Ended
- The Idaho Murders: College Nightmare — Returning Series → Ended
- Payback — Returning Series → Ended
- Peach and Me — Returning Series → Ended
Most Watched Movies this Week
=Disclosure DaynewSpider-Man: Brand New DaynewSupergirl-2The Odyssey=Masters of the Universe-2Obsession-1The Mandalorian and Grogu-5BackroomsnewAvatar Aang: The Last Airbender-2Project Hail Mary
Most Watched Shows this Week
=House of the Dragon=Silo=Rick and Morty=Lucky+4Star Trek: Strange New Worlds=Cape Fear-2X-Men '97newStuart Fails to Save the Universe-1One Piece-3The Bear
Popular Trailers
 "Roar" — The End of Oak Street
- We love Ice Cream....Just... maybe skip the truck this year — Ice Cream Man
- Don’t miss the ⭐ ⭐ ⭐ ⭐ ⭐ (James King, BBC Radio 2) — Spider-Man: Brand New Day
- Episode 3 Preview — Stuart Fails to Save the Universe
- destination: Motunui — Moana
- Official Trailer 2 — Fall 2: Deadpoint
- Season 18 Official Trailer — It's Always Sunny in Philadelphia
- One. Last. Game. The final countdown begins. — Jumanji: Open World
- Official Trailer — The Last Sunrise
- Season 4 Official Trailer (Together) — Ted Lasso
Hi, I’m Kevin 👋. Product Manager at Trakt and creator of Rippple. If you’d like to support what I'm building, you can download Rippple for Trakt, explore the open source project, or go Trakt VIP.
from  Tecida à mão
O significado de “nasce uma mãe, nasce uma culpa” nunca fez tanto sentido como agora. Eu poderia trocar a palavra culpa por medo, mas como creio que no amor não há medo, vamos manter assim.
Nós já somos mães antes mesmo do bebê nascer. Na gravidez, os primeiros pensamentos intrusivos começam quando: “tomei horrores de café e não sabia que tava grávida, se acontecer qualquer coisa, a culpa é minha”. As primeiras 6 semanas chegam e com ela os enjoos, e você “caraca, não está legal, será que vou odiar estar grávida? Mas eu sempre desejei isso.” Culpa.
Passam-se os meses e você começa a se questionar sobre tudo: e se eu parar de treinar e atrapalhar o futuro do meu bebê por isso? E se eu continuar treinando e ele nascer prematuro? Culpa.
O bebê nasce e você decide dar chupeta. “Ah, mas no futuro você não vai conseguir tirar dele mais”. Dentes tortos, e a culpa vai ser de quem? Minha. E se não der, e o bebê passar horas chorando? Noites e noites sem dormir? Culpa.
Eu poderia citar inúmeras situações que me ocorreram nesses 9 meses de gravidez mais 7 meses de pós parto, mas hoje entendi que a culpa nada mais é do que aquilo que a sociedade impõe e nossa mente condiciona a pensar que estamos 100% erradas.
Temos acesso a todo tipo de informação, que no passado nossas mães e avós não tinham, o que nos leva a achar que tudo que fazemos está sempre a ponto de receber uma crítica em algum post de coach no Instagram. Ou pior – no famoso grupo de mães – onde todas ja tem experiências diferentes daquela que você ta vivendo.
Bom, eu queria estar escrevendo aqui que a culpa já não me persegue mais, mas a verdade é que cada novo ciclo que nosso bebê entra, temos algo novo para nos questionar.
Hoje aqui em casa está sendo o fato do meu filho não dormir a noite toda no bassinet e termos que colocar ele para dormir no meio de nós.
Meu marido ama dormir na presença do nosso filho e faz questão de pedir que compartilhemos a cama toda vez que ele chora no bassinet. Peraí, mas com 7 meses já tem filho dormindo no próprio berço, como que ainda o seu não está? Pois é. Aonde foi que eu errei? Na minha cabeça, esperaria os 6 meses fecharem, ele iria no dia seguinte para o seu quarto sozinho, dormir no seu berço a noite toda, e todos seríamos felizes.
Mas a verdade é que assim como nós precisamos de adaptação para tudo, um bebê também precisa. Tentei por duas noites seguidas deixar ele até a manhã do dia seguinte no bassinet e o resultado foi desastroso. Ninguém dormiu. Meu marido foi trabalhar com poucas horas de sono, eu também. O bebê irritado. Por mais que na minha cabeça a fórmula funcionaria, a realidade é que desistimos. E no dia seguinte lá estava ele no meio de nós novamente. Sono dos anjos. Sim, escolhemos nossa paz e nossa noite de sono um pouco menos interrompida.
Tenho muitas amigas mães e, acredite, TODAS que eu conversei tiveram opiniões extremamente diferentes, pois cada uma vive uma realidade completamente diferente. Mesmo todas com filhos iguais a mim.
Tem a mãe que dorme no quarto do filho, enquanto o pai dorme com o outro em outro quarto, tem a mãe que deixou chorar por uma semana até conseguir dormir sozinho no berço, teve outra que buscou ajuda e foi a uma clínica de sono para bebês. Tem a mãe que dorme com a filha até hoje. E tem a outra que com 4 meses já conseguiu colocar sua bebê no berço. E todas elas, a mesma pergunta direcionada a mim: o que funciona para VOCÊ?
Pois bem, aqui estou eu me sentindo culpada por mais uma noite ter falhado e já saber que irei colocar meu filho pra dormir comigo. Ao mesmo tempo que: aqui estou eu feliz, pois irei dormir cheirando minha cria e sei que esse tempo NUNCA mais vai voltar, e por mais que hoje pareça difícil, amanhã vai ser só uma saudade do que já passou.
Então fica a reflexão para nós mães. Vamos parar de nos comparar com o mundo ao nosso redor? Nosso filho é único, terá uma experiência única dentro da nossa casa, e a disciplina e educação dele, seja referente a rotina ou qualquer outra coisa, só cabe aos pais saberem. Ninguém mais.
Então, pelo menos hoje, que essa culpa vire um consolo para te dizer: você está fazendo o seu melhor para o seu bebê.
from untidy creatures.
Charlie has become gatekeeper to the rediscovery of my withered intellectual pursuits and deflated attention span. She rouses at me if I try to watch Netflix. Television is a no-go in all forms. It rots my brain, and distracts from the more important issues (a cockatoo, of course). So I'm reading books instead. Typical. The things that nearly kill us are also the things we need to grow.
Either that or not only will she not let me breathe but also she's denying me the right to switch off my brain for an hour… or another decade. Same difference.
Learning to Live Without My Glasses
from Mitchell Report
I saw the title of Antonio’s post the other day on bubbles.town, “I Couldn’t Live Without My Glasses”, and it intrigued me.
The first thing I do when I wake up isn’t checking my phone or making coffee. It’s putting on my glasses.
This was never me. I was the opposite. I could see my phone and other things up close, such as the alarm clock. Putting on my glasses was usually the second or third thing I did because I needed them to see at a distance.
Before cataract surgery, I was nearsighted and also had astigmatism. I could see things up close without glasses, but I needed my glasses to see clearly at a distance and for almost everything else. What Antonio wrote still struck a chord with me because I could relate to nearly every word in his post.
Cataract surgery completely changed that. My new intraocular lenses (IOLs) were set for distance, so I can now see far away without glasses. However, they cannot focus up close the way my natural lenses once could, which means I now need reading glasses for my phone, the clock, and anything else nearby. As for trying to read without them, forget it. My arms are not long enough.
I go at the end of this month to get a proper prescription for reading glasses. Having worn glasses for 41 of my 57 years, I do not mind wearing them. I also agree with Antonio:
It’s crazy to think how something so small could easily become the most important thing I own.
Antonio also wrote:
Most people fear losing their wallet or their phone. I fear losing my glasses. Replacing them isn’t just an inconvenience; it’s two weeks of depending on other people to drive me places, struggling through work, and navigating a world that’s permanently just out of focus.
Before cataract surgery, I could wholeheartedly relate to this. I broke my glasses once, and another time, when I was younger, I left them on top of the car after taking them off because they had fogged up. I did not realize what I had done until several minutes later.
Now that I have IOLs set for distance, losing or breaking my reading glasses would still be inconvenient, but it would no longer leave the whole world out of focus. I also no longer have to worry about my glasses fogging up when I am trying to see at a distance. That is another small change I have come to appreciate.
It is strange how a post like this can stir so many feelings in someone, but his did. That is probably because of my recent troubles with my eyes and the experience of being able to see everything in a completely new light, although still with some limitations.
Despite how important they are, they’re not something I think about once I put them on. I only notice them when I don’t have them on.
I could completely relate to this before cataract surgery. Now, however, it feels extremely strange not to wear glasses except when I am trying to read or see details up close.
Related: I wrote more about my cataract surgery in My Vision’s Big Comeback.
Overlord's Annals Zine: Volume 5 Issue 8
 Attronarch's Athenaeum
A zine chronicling the Conquering the Barbarian Altanis D&D campaign.
This issue details sessions 117, 118, and 119.
Charmed by gold; charmed by lust; charmed by the witch.
You can download the issue here.
Overlord's Annals zine is available as part of the Ever & Anon APA, issue 14:
#Zine
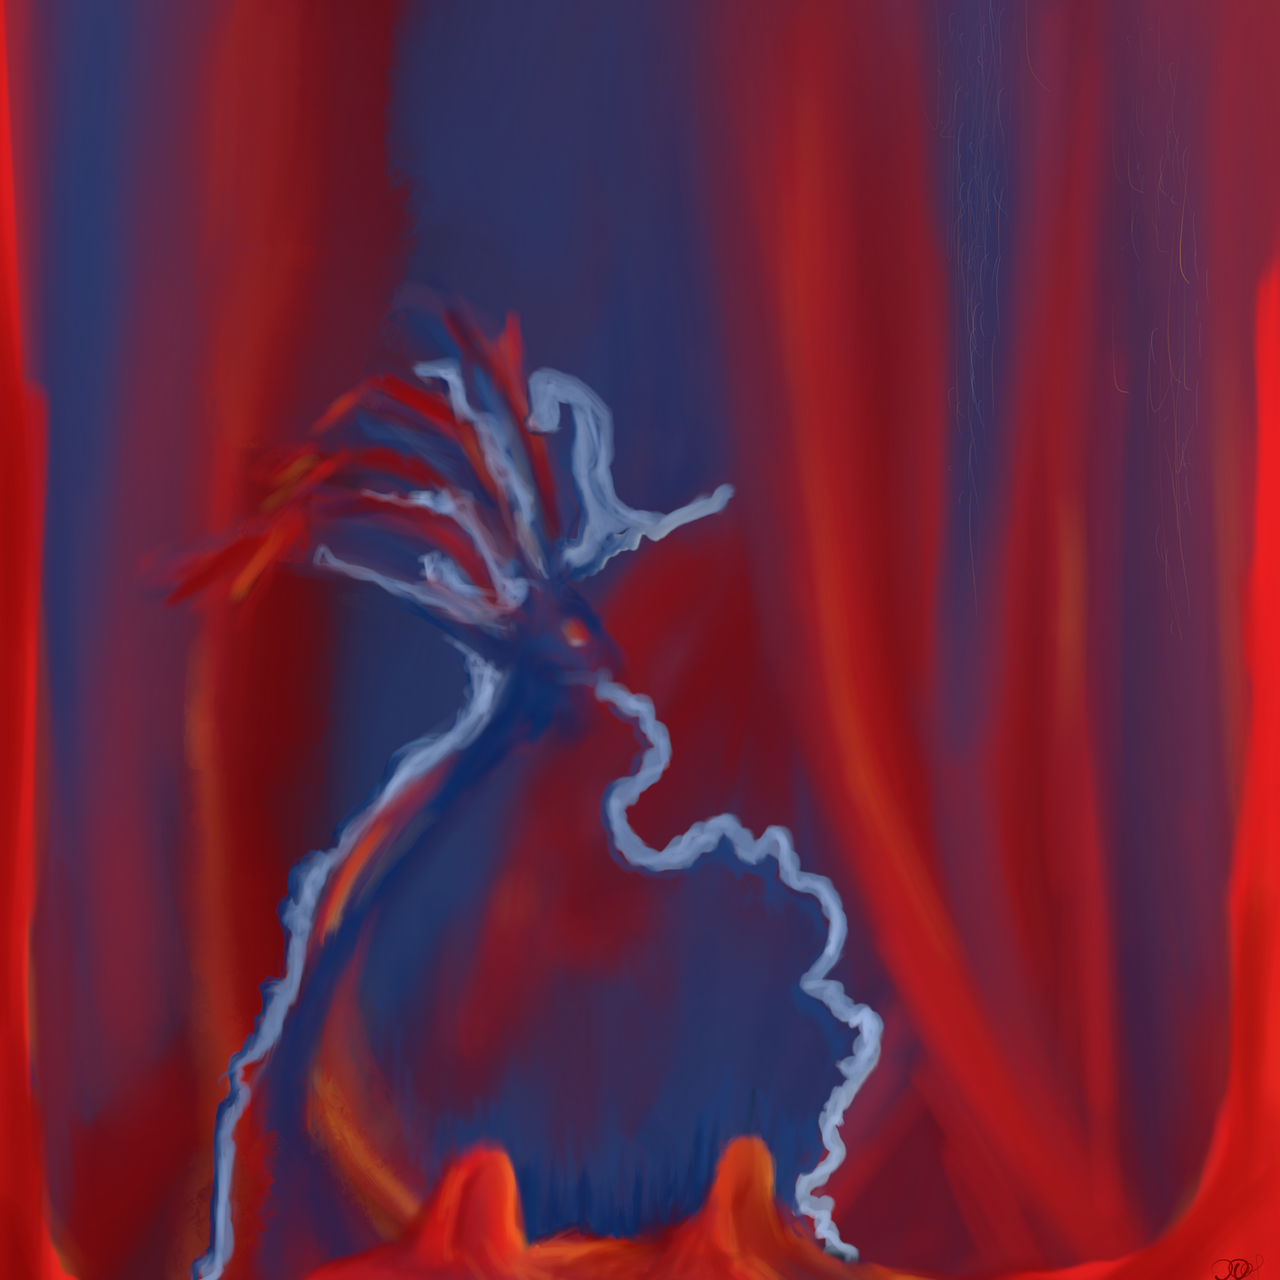
The Scorched Barb
from AnOublietteofThought
Is it possible to not get singed when in close vicinity of someone determined to commit spiritual self-immolation? I don't know. Trying to release the residue of such an encounter had me doodling this for tonight's digital meditation painting on my phone.
I openly admit that I suck when it comes to painting on my phone, but there's something about the act of doing so that floods me with great relief. Perhaps it is because it's the one media I don't feel bad about mucking up, and I just allow myself to move color around. There is such freedom in that.
While doing so tonight, I realized the expectations I place upon myself are often quite silly and counter-productive. I think I'm going to make myself share more of them here due to that. Not all, but maybe the ones representing an important moment.
There is a person in my life who likes to compare today's me with a me from thirty years ago. With a me who was not comfortable in her own skin, but was determined to be seen in a very specific light. She was not succeeding in the way that I now define success. She was exceptionally good at surviving, and rose to every challenge that came her way. She was miserable most of the time. Terrified more often than not. And mistakes were not allowed. She wasn't someone I'd encourage anyone to be. She definitely did not love herself.
Today, I do. He seems to have a real problem with that. I think it more that he can't stand himself therefore he needs someone to project all of that self-loathing on to. When he decides to go there, it's a massive energy suck from multiple directions, and it always leaves me feeling it in a multitude of ways. I have gotten much better at navigating that.
I wasn't sure if writing this or sharing the doodle was the correct choice. I now find my eyes growing heavy to the soothing sounds of nature I have raining in the background. That tells me the magic of acknowledging is working. I am grateful for the sleepy smile this contemplation has gifted me. Perhaps come morn I will feel much lighter.
Written August 1, 2026. © 2026 AnOublietteofThought.